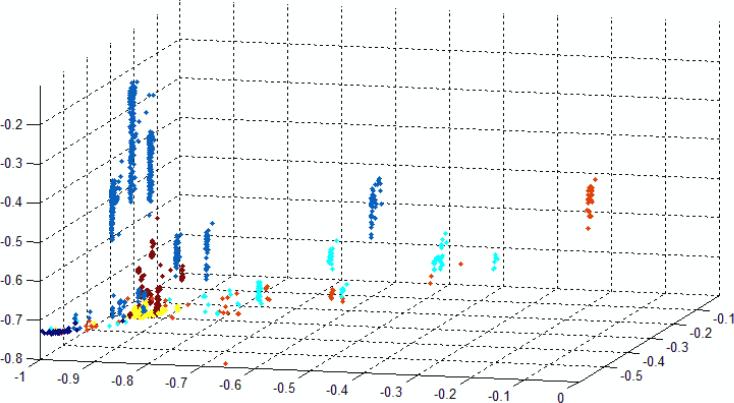
Figure 9.
2D projection of a 3D plot in which the axes are linear (orthogonal) combinations of 14 spike parameters showing one view of the separation of the 5 bases and water into distinct clusters (overlapped somewhat in this 2D projection). With the exception of the G and water signals, data are spread out in distinct groups suggesting that discrete sets of configurations are sample in the recognition-tunneling gap. (Water signals were not removed from this data set by prefiltering.) Color code: Blue = dAMP, Red = dTMP, Turquoise =dCMP, Brown = dmeCMP, Yellow = dGMP, Black = water.

