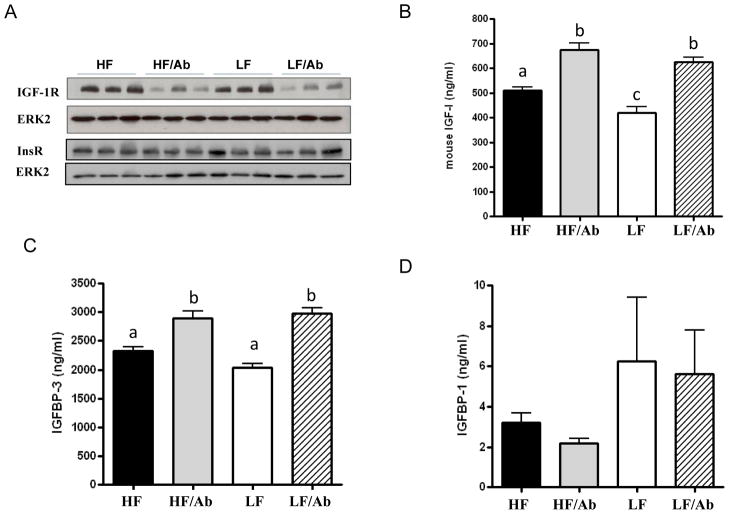
Figure 2. Modulation of the IGF axis by IGF-1R blockade and low-fat diet.
A/ IGF-IR and insulin receptor levels in 22Rv1 xenograft tissue. Total ERK2 was used as a loading control. The Western blots are representative of one experiment (n-3 animals per group). The western blots were done on a total of 5 animals per group. B, C and D/ Fasting serum IGF-I, IGFBP-3 and IGFBP-1 concentration of SCID mice on the different therapy regimen. Serum IGF-I, IGFBP-3 and IGFBP-1 levels were assessed using ELISA. Values are means ± standard errors (SE). Means with letters a,b, or c are significantly different from each other (p<0.05, One way Analysis of variance with Tukey post test).

