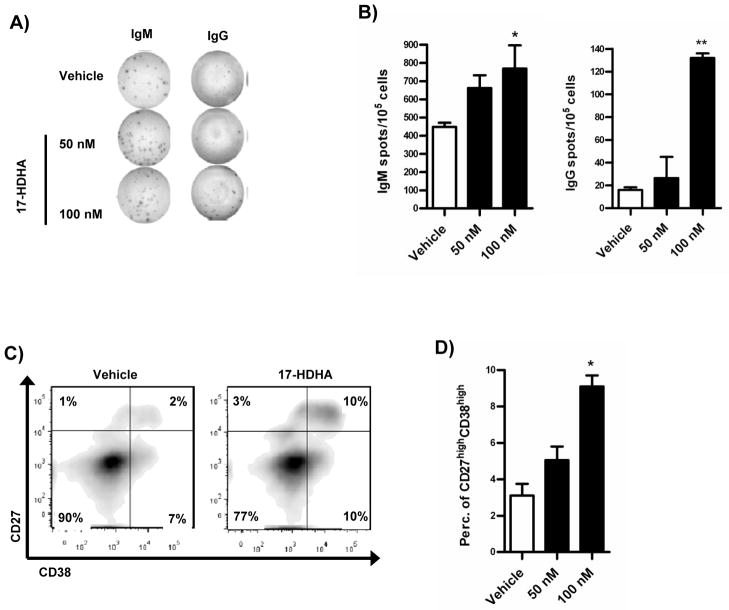
Figure 6.
Antibody-secreting B cell differentiation is enhanced by 17-HDHA. Purified human B cells were collected on day 5 after activation. Number of antibody secreting cells was measured by ELISpot analysis. A) Representative image of IgM and IgG specific spots. B) Quantification of IgM and IgG spot forming cells. 7 days after activation, cells were harvested and stained for surface markers. A live-lymphocyte gate was used in all flow cytometry analyses as well as FMO for gating controls. C) Representative dot plot of double positive cells. D) Quantification of live IgD−CD27+CD38+ cells. Data analyzed by one-way ANOVA with Tukey’s post test, *p≤0.05, **p≤0.01 and represented as ±SEM.

