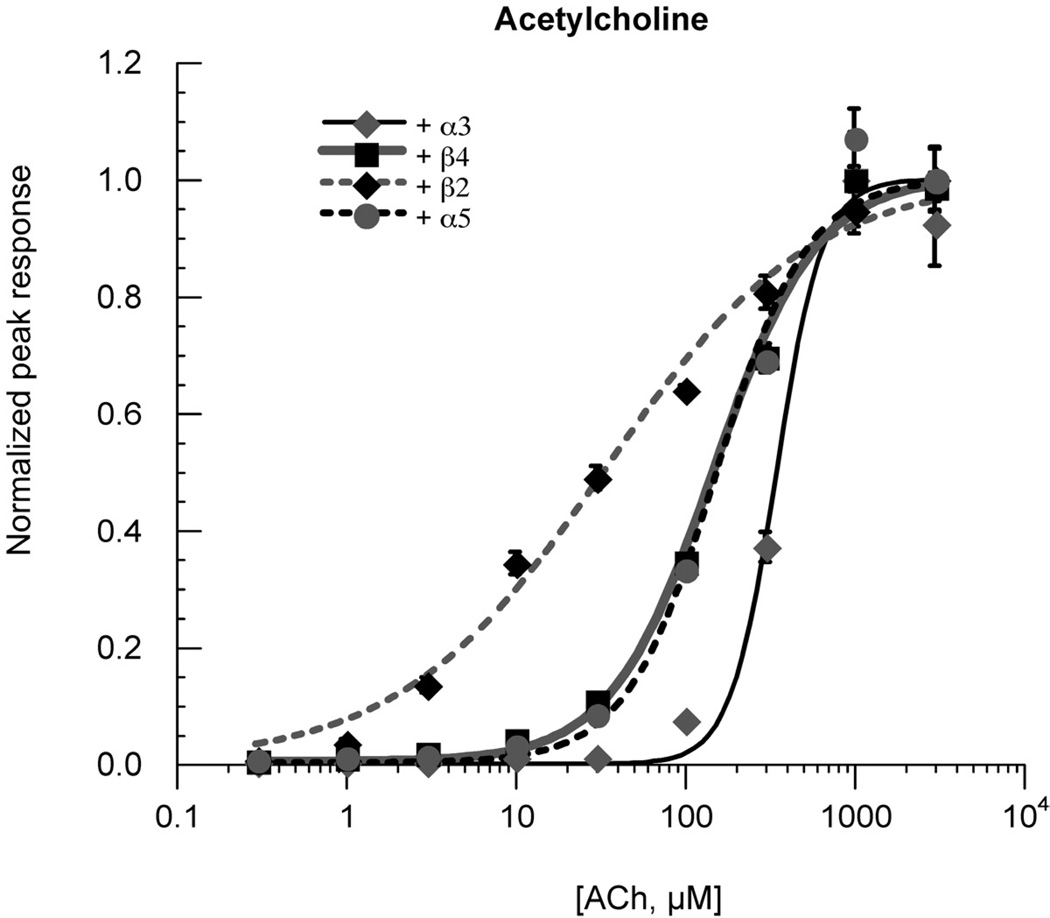
Figure 2.
ACh concentration-response curves. The β4–6–α3 concatamer was co-expressed at 1:5 RNA ratio with either α3, β4, β2, or α5. Data were initially normalized to 100 µM ACh control responses obtained immediately prior to the test responses and subsequently adjusted to the empirically determined ACh maximum responses. ACh controls remained of stable amplitude throughout each experiment. All points represent the average data (± SEM) for at least four cells. EC50 values (Table 1) were determined by fits of the data to the Hill equation (Methods).

