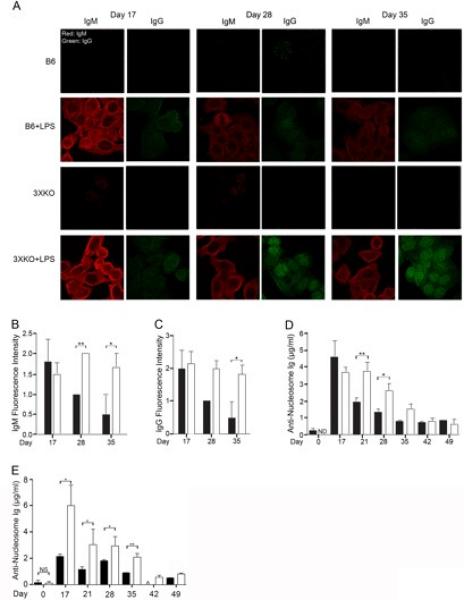
Figure 4. Innate immune responses induce autoantibodies in mice lacking IL-6, CD40L, and TNFα (3XKO).

(A) Representative IgM (red) and IgG (green) Hep-2 staining from B6 (top 2 rows) and 3XKO (bottom 2 rows), with (rows 2 and 4) and without (rows 1 and 3) LPS (1.25mg/kg days 0, 7, and 14). Images were captured at 60X magnification. (B) Compilation of fluorescence intensity of IgM autoantibodies from LPS-treated B6 (black) and 3XKO (white) mice. n=10 (C) Compilation of fluorescence intensity of IgG autoantibodies from LPS-treated B6 (black) and 3XKO (white) mice. n=10 (D) Total anti-nucleosome (IgG, IgM, IgA) levels from LPS-treated (1.25 mg/kg) B6 (black) and 3XKO (white) mice were quantitated on the indicated days. n= 7. (E) Total anti-nucleosome (IgG, IgM, IgA) levels from LPS-treated (0.9 mg/kg) B6 (black) and 3XKO (white) mice were quantitated on the indicated days. n= 5. Error bars depict SEM. **p≤0.01, * p≤0.05, NS; not significant, p>0.05).
