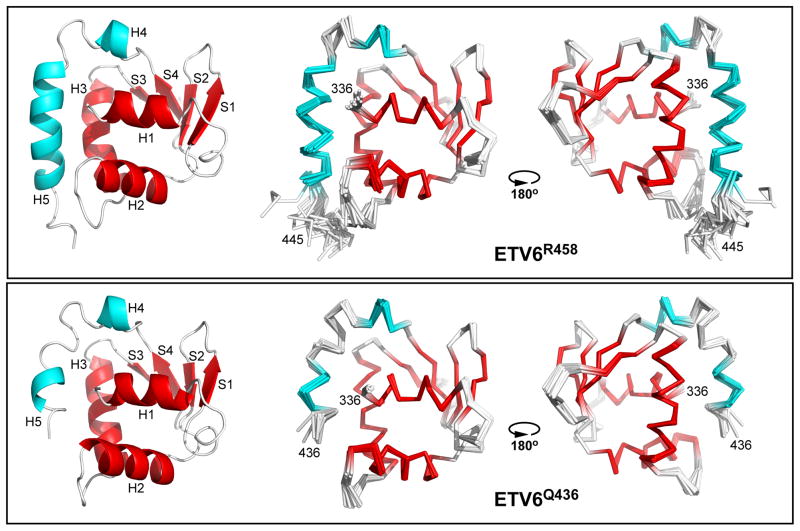
Fig. 2. Structural ensembles of ETV6Q436 and ETV6R458.
Shown are Cα-ribbon diagrams of the refined twenty member ensembles of ETV6R458 (upper) and ETV6Q436 (lower), along with a cartoon diagram of one low energy structure of each protein (left). The ribbon diagrams are rotated by ~180° about the vertical axis. The secondary structural elements of the ETS domain and CID are highlighted in red and cyan, respectively. The disordered N-terminal Gly-Ser-His-Met and C-terminal residues 446–458 have been removed for clarity.

