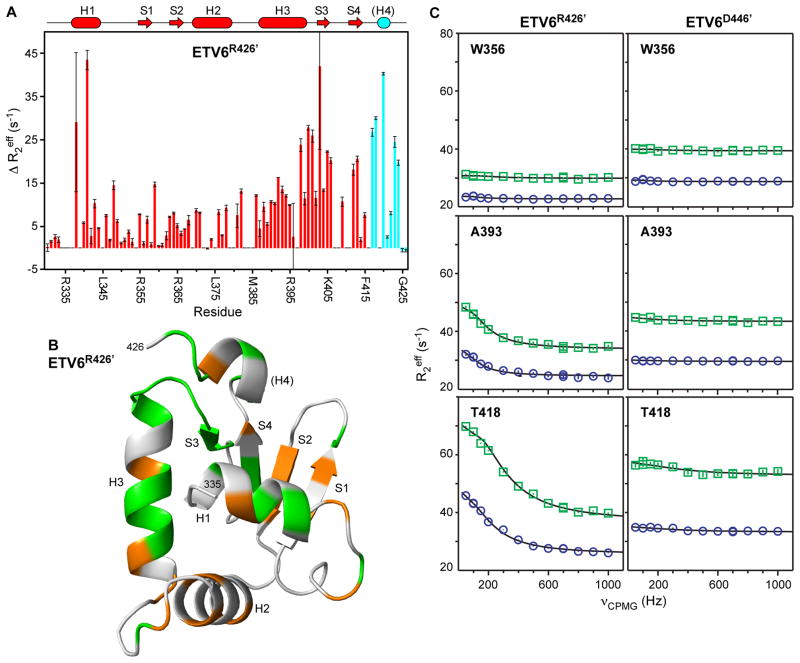
Fig. 6. Amide 15N relaxation dispersion experiments reveal msec-μsec conformational exchange in the ETS domain that is dampened by the CID.
(A) ΔR2eff values for ETV6R426′ from relaxation dispersion experiments with νCPMG of 50 Hz versus 1000 Hz, recorded using an 850 MHz NMR spectrometer. The cartoon representation of the secondary structure of ETV6R426 is also given with coloring as in Figure 2; however, it is unknown if helix H4 remains stably folded in this variant. (B) When mapped on the predicted structure of ETV6R426′, residues with an arbitrary cut-off of ΔR2eff > 5 s−1 (orange) or ΔR2eff > 10 s−1 (green) are broadly distributed through the ETS domain with some bias towards to the DNA-binding interface (centered around helix H3; see Fig. 7). In contrast, such exchange broadening is not seen for ETV6D446′ (Supplemental Fig. S6) or ETV6R458 (not shown) with an intact CID. (C) Complete relaxation dispersion profiles recorded with 500 MHz (blue boxes) and 850 MHz (green circles) spectrometers for uninhibited ETV6R426′ (left) and inhibited ETV6D446′ (right). Both Ala393 (helix H3) and Thr418 (between strand S4 and helix H4) show exchange broadening in ETV6R426′ but not ETV6D446′. Also presented is a control amide in Trp356 (strand S1) showing no dispersion in either protein. Error bars are smaller than the symbols, and the lines are best fits to a two-state exchange model.

