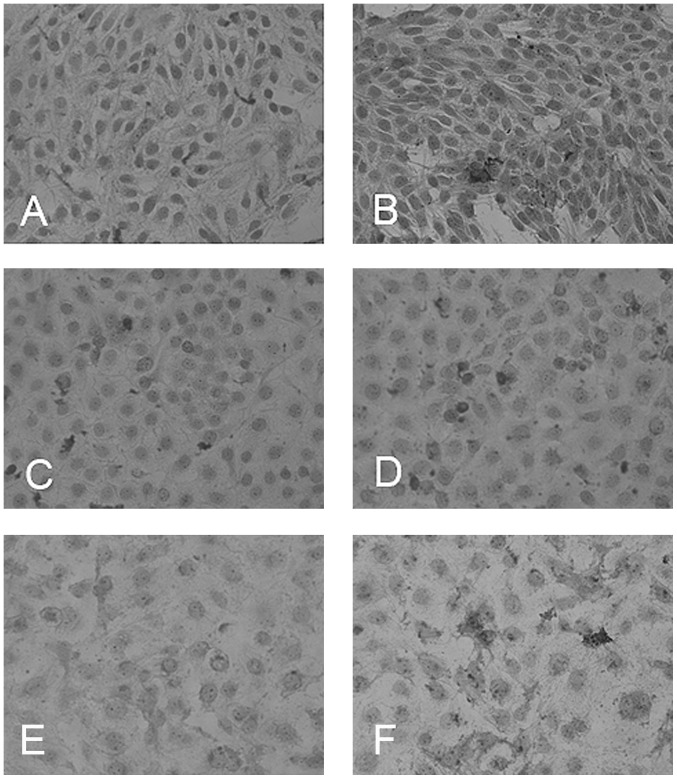
Figure 3.
Immunohistochemistry. To visualize apoptosis, ATO-treated cells were incubated with the M30 antibody. Slides were stained with Fast Red and counterstained with hemalaun. The photomicrographs were captured at a magnification of ×200. Untreated control: (A) SCC9, (C) SCC25 and (E) CAL27. Treated with 2 μM ATO: (B) SCC9, (D) SCC25 and (F) CAL27.

