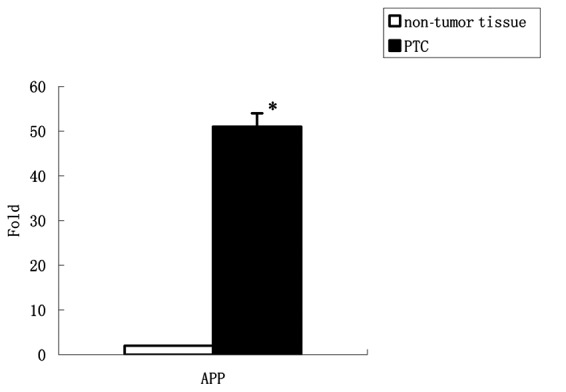
Figure 1.

qRT-PCR assay of relative APP mRNA levels in PTC and non-tumor thyroid tissues. Data were normalized to the expression of the housekeeping gene glyceraldehyde-3-phosphate dehydrogenase. The y-axis shows an increase in specific mRNA over unstimulated samples. Data are the mean ± standard deviation from triplicate experiments. *P<0.001 compared with non-tumor tissues.
