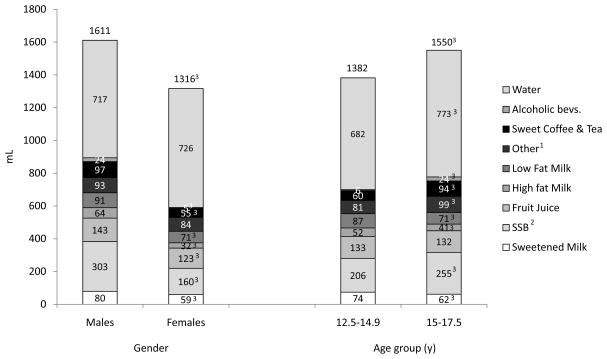
Figure 2.
Per capita fluid (mL) beverage consumption patterns among European adolescents (n=2,741) by gender and age.
1Includes diet drinks, unsweetened coffee, unsweetened tea, vegetable juice, other sweetened beverages, and other beverages.
2Sugar-Sweetened Beverages; includes calorically sweetened soda, fruit drinks, and sports drinks.
3Per consumer estimates for energy and fluid between gender or age groups are statistically significantly different from one another, students t-test p<0.05 using Bonferroni correction for multiple comparisons.

