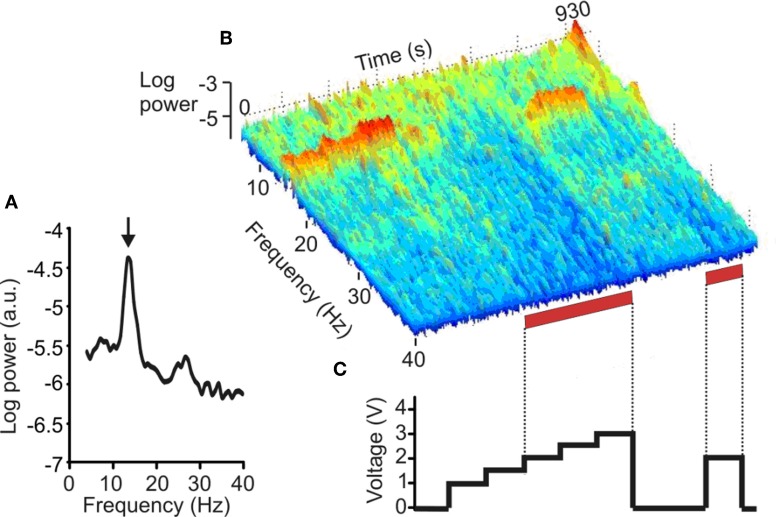
Figure 1.
Effect of DBS of the STN on the LFP. (A) Power autospectrum of LFP recorded without stimulation. There is a large peak arrowed at 14 Hz. (B) Frequency-time log power spectrum of LFP (contact pair 02). Red bars along the time axis denote periods of DBS at 2.0–3.0 V, which induced motor improvement but also dyskinesias of the contralateral foot. Note the suppression of the 14 Hz peak with stimulation = 2.0 V, and the delayed return of the 14 Hz activity after stimulation is terminated. (C) Timing and voltage of DBS applied at contact 1. (Adapted with permission from Eusebio et al., 2011).

