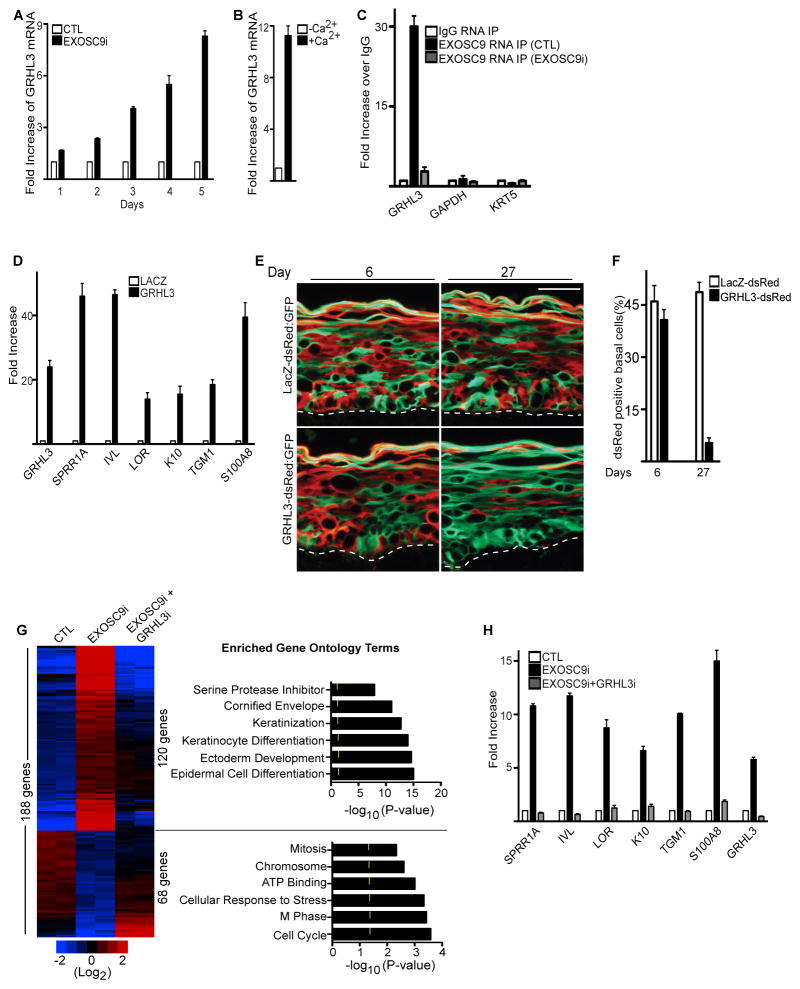
Figure 4. EXOSC9 prevents premature differentiation and maintains self-renewal in progenitor cells by regulating GRHL3 transcript levels.
(A) Loss of EXOSC9 results in increased levels of GRHL3. QRT-PCR on GRHL3 mRNA levels on days post EXOSC9 knockdown. (B) GRHL3 expression is increased during epidermal differentiation. QRT-PCR measurements on levels of GRHL3 increase during epidermal differentiation. Error bars=mean with SEM. (C) EXOSC9 binds to GRHL3 but not GAPDH or KRT5 transcripts. RNA immunoprecipitations (RIP) were performed using an antibody against EXOSC9 or mouse IgG on paraformaldehyde crosslinked nuclear extracts isolated from control (CTL) or EXOSC9i cells. QRTPCR was used to determine the levels of binding. Error bars=mean with SEM. (D) Forced expression of GRHL3 in epidermal progenitor cells results in premature differentiation. 4 days post-transduction of cells with a GRHL3 or LacZ encoding retrovirus, cells were harvested and assayed using QRT-PCR. Error bars=mean with SEM. (E) Epidermal progenitor competition assay. dsRed expressing epidermal cells were transduced with a retroviral construct encoding GRHL3 or LacZ. These cells were mixed at a 1:1 ratio with GFP expressing cells and used to regenerate human epidermis. GFP cells =green; dsRed cells= red. The dashed lines denote basement membrane zone (Scale bar=40μm; n=3 grafted mice per construct per timepoint). (F) Quantification of dsRed positive cells in the basal layer. (G) Knockdown of GRHL3 in EXOSC9i cells rescues the differentiation and growth arrest phenotypes of EXOSC9i cells. Heat map (left panel) of control (CTL), EXOSC9i, and EXOSC9i+GRHL3i cells. Red(induced) and blue (repressed), log2-based scale. Gene ontology analysis (right panel) of the genes rescued by double knockdown. Yellow mark in bar graphs demark p value=0.5. (H) GRHL3 is necessary for the differentiation effects of EXOSC9i cells. QRT-PCR verification of array data. Error bars=mean with SEM. See also Figure S4 and Table S3.

