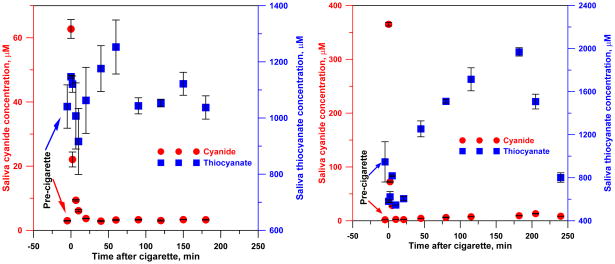
Figure 9.
Saliva cyanide and thiocyanate concentrations before and after smoking a cigarette. Left: heavy smoker; right: occasional smoker. The cyanide and thiocyanate time profiles are shown for illustrative purposes. The number of subjects is insufficient to infer any statistically meaningful difference between occasional vs. heavy smokers.

