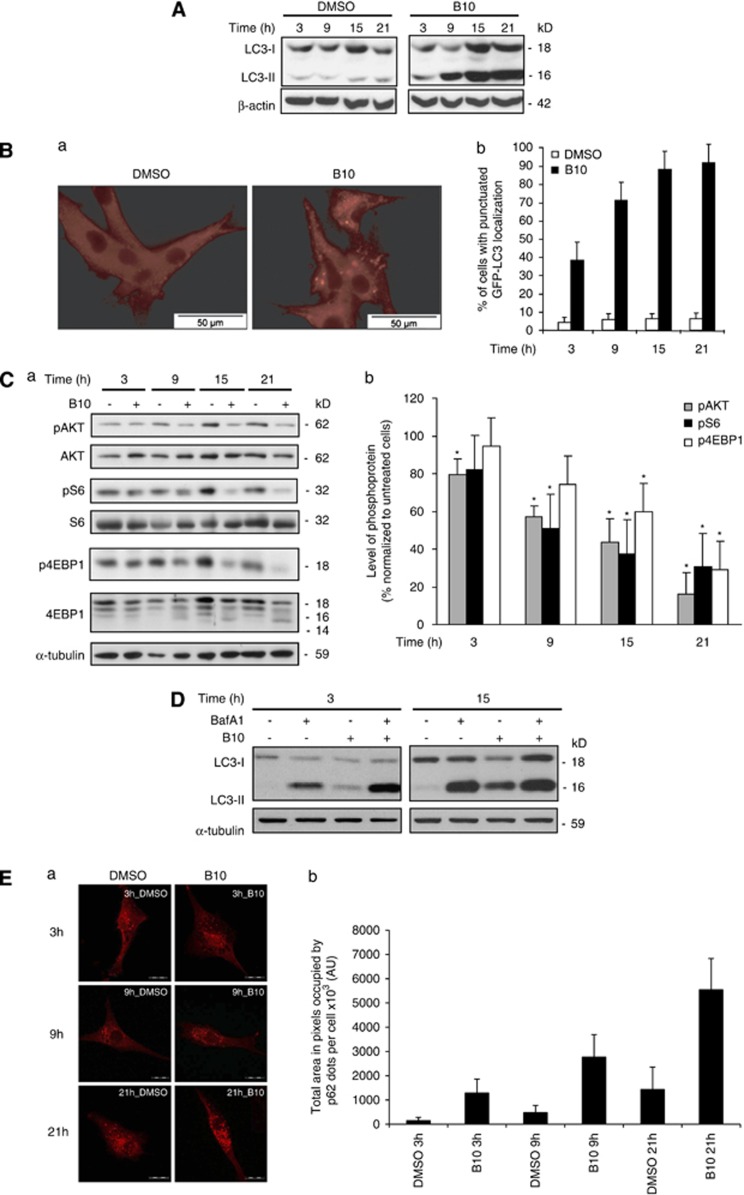
Figure 4.
Accumulation of lipidated LC3 correlates with the PI3K/Akt/mTOR pathway inactivation upon B10 treatment. (A) U87MG cells were treated for indicated times with 18 μM B10 or DMSO, and LC3 and its lipidated form were detected by immunoblot analysis. (B) The localization of endogenous LC3 was determined by immunofluorescence in cells treated with 18 μM B10 or DMSO for 21 h (a and b). The kinetic of GFP-LC3 translocation was determined by counting cells presenting with a punctuated GFP-LC3 localization after treatment with 18 μM B10 for indicated times. Mean+S.D. of three independent experiments are shown. (C) Phosphorylation status of Akt, ribosomal protein S6 and 4EBP1 was analyzed by western blot analysis upon with 18 μM B10 or DMSO for the indicated time points (a). Quantitation of phosphoproteins was normalized to total protein levels and and mean+S.D. of three independent experiments are shown; P values were calculated against DMSO, *P<0.05 (b). (D) U87MG cells were treated for indicated times with 18 μM B10 or DMSO in the absence or presence of BafA1. LC3 and its lipidated form were detected by immunoblot analysis. (E) p62 protein expression was assessed by immunofluorescence using confocal microscopy in U87MG cells treated with 18 μM B10 for indicated times; scale bar: 100 μm (a). The area occupied by p62 dots per cell was quantified using ImageJ digital imaging software (b). Mean+S.D. of five cells per sample are shown

