Figure 1.
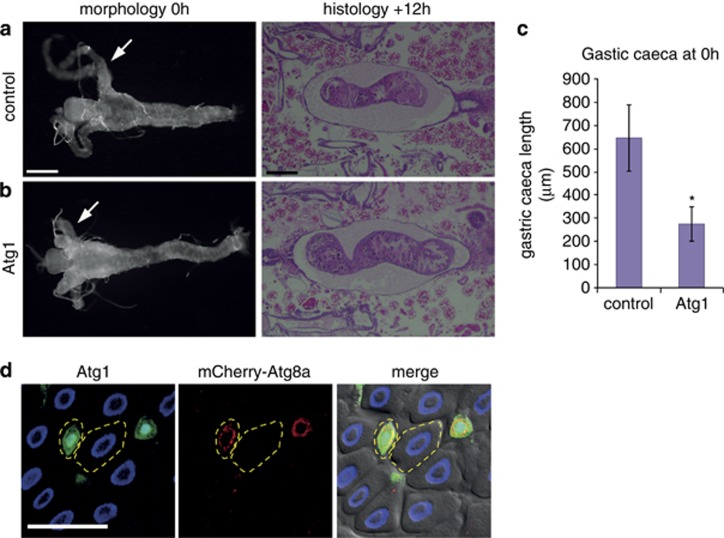
Premature induction of autophagy induces midgut PCD. Morphology of midguts at 0 h RPF (left) showing (a) control (NP1-GAL4/+) compared with (b) Atg1 overexpression (NP1-GAL4/+ UAS-Atg16B/+) with premature contraction of gastric caeca (arrows). Histological analysis of paraffin sections at +12 h RPF (right) shows that at the later time point midgut contraction is similar in (a) control (NP1-GAL4/+) and (b) Atg1 overexpression (NP1-GAL4/+ UAS-Atg16B/+). Scale bars in (a) represent 200 μm. (c) Quantification of the length of the gastric caeca at 0 h RPF measured with Zeiss automeasure software from control (NP1-GAL4/+) and Atg1 overexpression (NP1-GAL4/+ UAS-Atg16B/+) (N=4 and 9, respectively). Quantification is average length (μm)±S.D. *P<0.001 (compared with the control). (d) Mosaic clones from feeding larvae expressing Atg1 marked by GFP (green) and DNA (blue) (hsFLP; mCherry-Atg8a/+ Act>CD2>GAL4, UAS-nlsGFP/UAS-Atg16B) have increased mCherry-Atg8a puncta (red) compared with the neighbouring cells and smaller cell size. Atg1 clone and neighbouring cell outlined. Scale bars in (d) represent 50 μm

