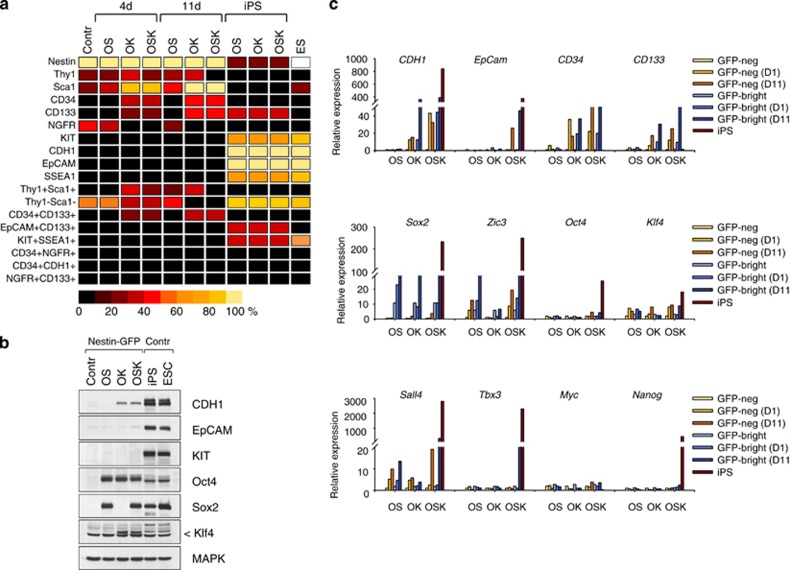
Figure 5.
Multilineage pattern of gene expression parallels induction of pluripotency. (a) Schematic heat map showing the percentage of Nestin-GFP-bright cells with co-expression of lineage-specific genes as determined by FACS analysis. The analysis before (Control) and after transduction with OS, OK or OSK viruses is shown at the indicated time points. Expression profiles of iPS and WT ES cells are shown for comparison. Color scale indicates the percentage of cells that express the indicated markers. (b) Immunoblot analysis of Nestin-GFP-bright MEFs before (Control) and 7 days after transduction with OS, OK or OSK viruses. Expression profiles of iPS and WT ES cells are shown for comparison. MAPK is a control for equal loading. (c) Quantitative real-time reverse transcription--polymerase chain reaction (qRT-PCR) analysis of the indicated endogenous genes in Nestin-GFP-negative (yellow group) and Nestin-GFP-bright MEFs (blue group) before and 1 or 11 days after transduction with OS, OK or OSK viruses. Data were normalized to the corresponding HPRT value to obtain relative changes in the indicated mRNAs. Mouse-specific primers that did not cross-react with the exogenous human counterparts were used for Oct4, Sox2 and Klf4

