
Figure 3. Resequencing of DNA oligomers.
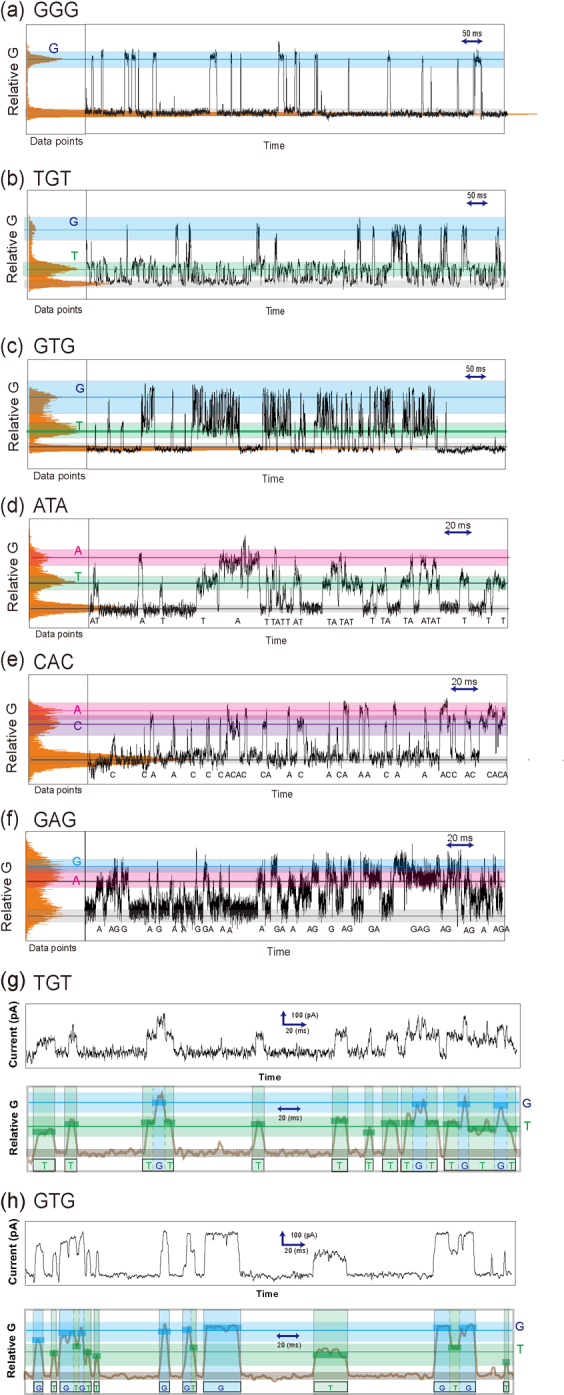
Relative conductance (G)–time profiles of (a) GGG, (b) TGT, (c) GTG, (d) ATA, (e) CAC and (f) GAG. The relative G values are summarized in Table 2. The left panels in each figure show the related G histograms. Upper and lower panels show expanded I-t and smoothed G-t profiles of (g) TGT and (h) GTG. The blue, red, purple and green lines and bands in all figures represent the relative G and its dGMP, dAMP, dCMP and dTMP bands, respectively.