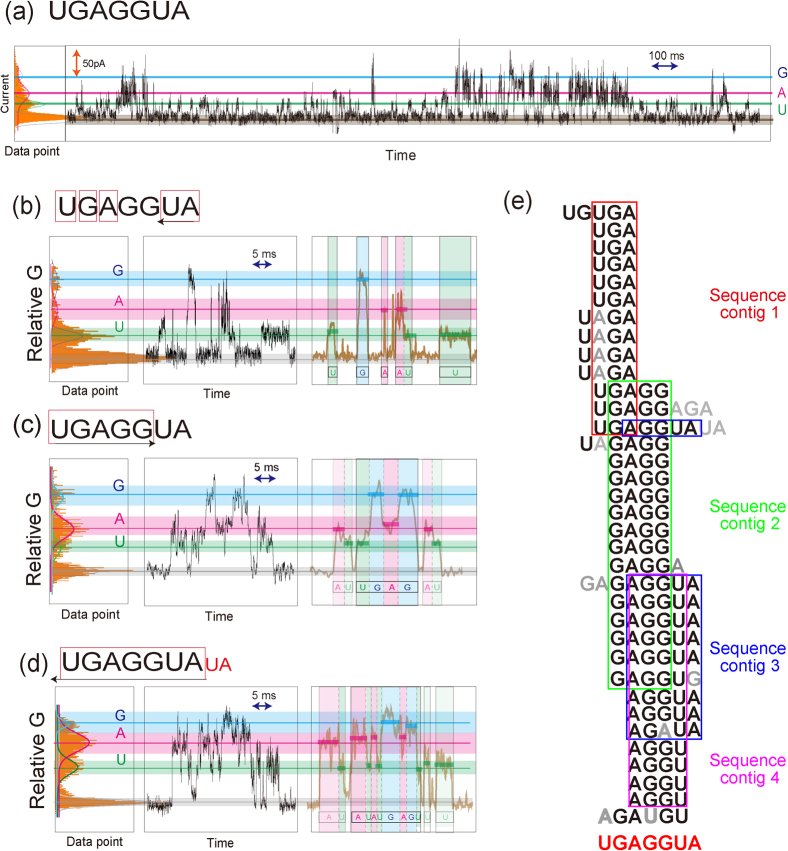
Figure 4. Random resequencing of 5′-UGAGGUA-3′ microRNA.
(a)Typical I–t profiles from a 1.0 μM solution of UGAGGUA with 100 mM phosphate buffer. (b)–(d) Typical relative G histograms, raw and smoothed G-t profiles of randomly fragmented sequences. Purple, red and blue lines and bands show relative G values (Table 3) and rUMP, rAMP and rGMP bands, respectively. (U, G, A, UA), (AU, UGAGG) and (U, UA, UGAGGUA) were resequenced according to the G-t profiles in (b), (c) and (d), respectively. (e) The 35 randomly fragmented sequences used for resequencing the microRNA. Sequence contigs 1–4 were assembled by fragment sequences within the red, green, blue and purple frames. The full sequence of the microRNA was determined by overlapping the 4 sequence contigs.

