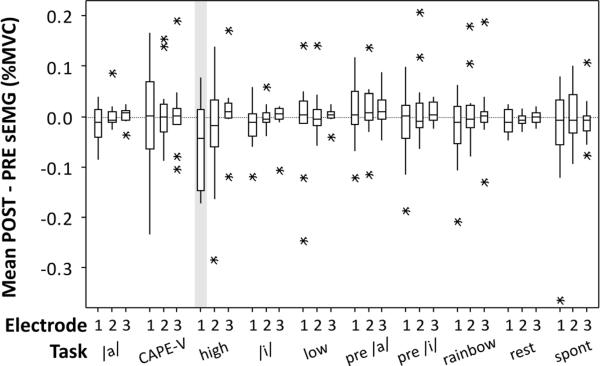
Figure 2.
Boxplots of the POST – PRE difference in RMS sEMG at the three electrode positions as a function of vocal task. Horizontal box lines indicate the lower and upper quartiles of the data, with the center line marking the data median. Asterisks show the location of the data means. Vertical whiskers extend from the boxes to the minimum and maximum values of each dataset. The grey shading indicates the single electrode position and vocal task combination that showed a statistically significant (p < 0.05) reduction in the POST condition relative to the PRE condition.

