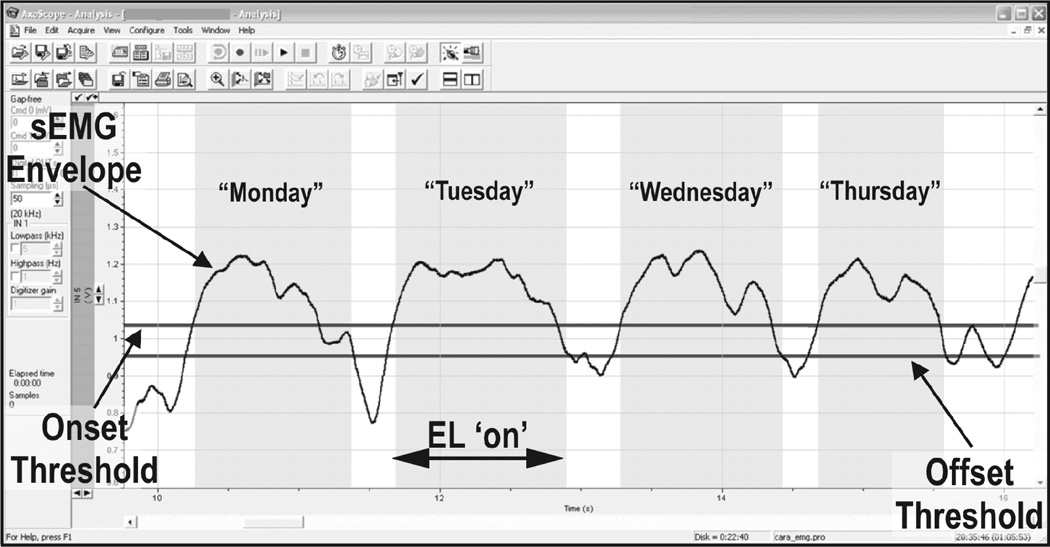
Figure 3. Example Screenshot of sEMG Biofeedback.
An example of the real-time visual feedback of the RMS sEMG and EMG-EL threshold settings is shown. The black line shows the sEMG envelope used to control the onset and termination of the EMG-EL. The two red lines specify the settings for onset threshold and offset threshold. The blue shading indicates time periods during which the device was activated.

