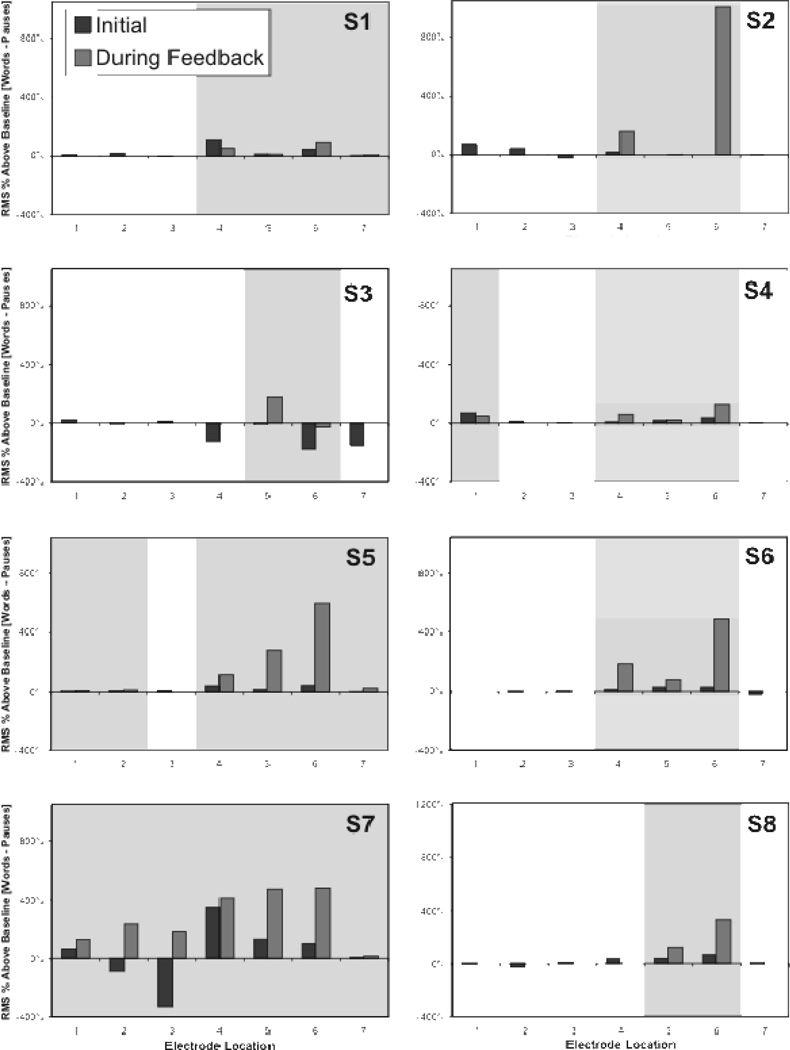
Figure 5. Participant sEMG during Serial Speech.
The difference between words and pauses in the percent above baseline RMS sEMG from each recording location during serial speech using a traditional EL (labelled as “Initial”) and during use of the EMG-EL with visual feedback (labelled as “During Feedback”) for each participant. Electrode positions for which each participant achieved at least 80% serial speech performance using the EMG-EL are indicated with background shading in grey.

