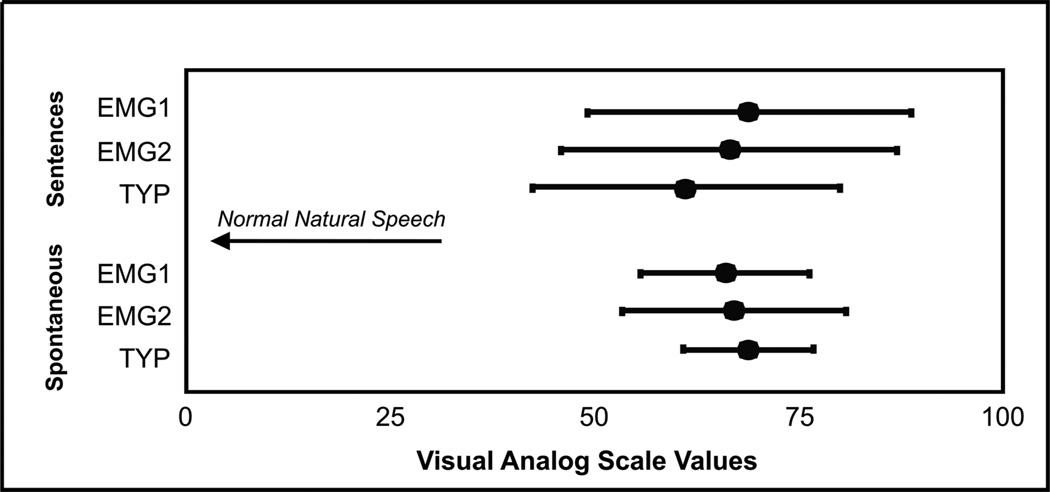
Figure 6. Visual Analog Scale Perceptual Results.
The results of the visual analog scale assessment are shown graphically, separated by speech task (“Sentences” and “Spontaneous”). Blue circles indicate average visual analog scale scores with error bars extending +/− one standard deviation. On this scale, normal natural speech is located at 0.

