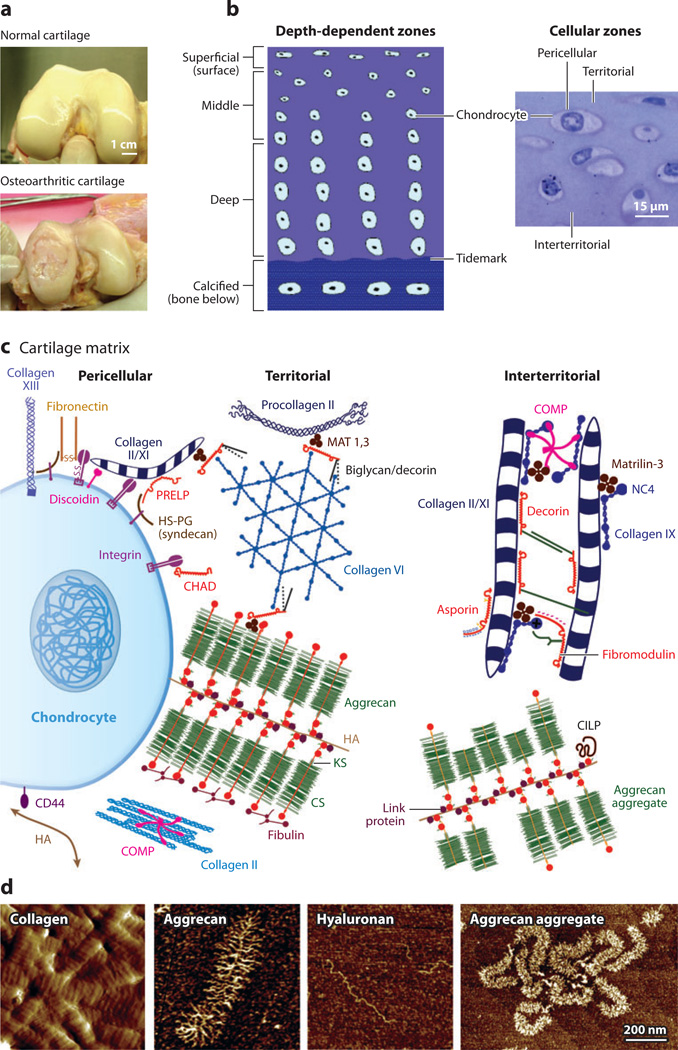
Figure 1.
Schematic illustration of the molecular constituents in cartilage and their arrangement into large multimolecular assemblies.
(a) Macroscale comparison of normal (healthy) and osteoarthritic human cartilage tissue; courtesy of Drs. D. Chai & C.Wheeler.
(b) Cross-sectional schematic of cartilage tissue showing a depth-dependent zone and gradient in cell size, shape, and collagen network morphology. The cells are flattened near the surface (superficial zone) and become larger and rounder with increasing depth in the middle and deep zones. The tidemark is the boundary between the nonmineralized and the mineralized (calcified) cartilage. In addition, the cartilage extracellular matrix is organized into pericellular, territorial, and interterritorial matrices, each of which is present at increasing distance from the chondrocyte cell surface. Panel b adapted with permission from Reference 34. (c) Matrix molecular composition and organization in the different extracellular regions. At the cell surface, many receptors interact with specific matrix molecules as well as with soluble proteins (e.g., growth factors). Matrix molecules in this pericellular zone are also connected to molecules in the territorial region. Panel c adapted with permission from Reference 35. (d) Nanostructures of different cartilage molecular constituents via tapping-mode AFM imaging. Type II collagen fibrils from proteoglycan-digested calf knee cartilage surface (amplitude image), single aggrecan and hyaluronan molecules, and aggrecan aggregates composed of fetal bovine aggrecan noncovalently bound to hyaluronan, which is further stabilized by the small globular link protein (height images). Panel d reproduced with permission from Reference 36 and courtesy of Dr. H.-Y. Lee.

