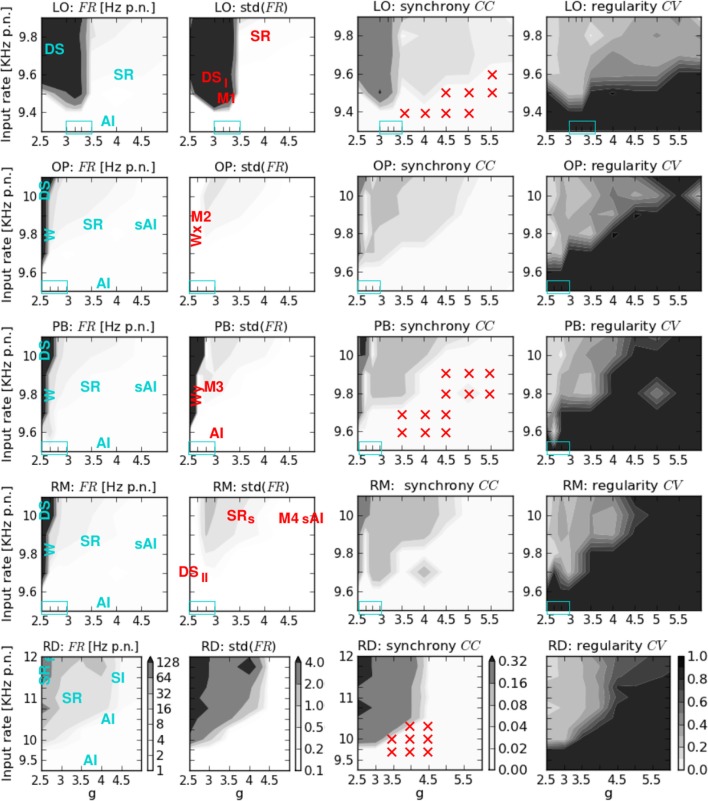
Figure 2.
Phase space analysis of the spiking activity of the five network structures. From left to right: av. firing rate per neuron FR and its standard deviation, av. correlation coefficient CC, and coefficient of variation CV. From top to bottom: locally connected network (LO), two networks with combined local and patchy remote connections (OP, PB), a network with local aand random remote connections (RM), and a randomly connected network (RD). On the x-axis g denotes the ratio between exc. and inh. synaptic weights, while ν on the y-axis indicates the input rate. The colorbars shown at the bottom (RD) are valid for all plots in the corresponding column. Blue text in the FR plots describes the states that occur at the corresponding phase space positions. The transition regions (zoom-in values for g) are indicated by the blue boxes in the lower left. Red text in the std(FR) plots describes the positions of the specific dynamical patterns shown in Figures 3, 4, and 5. Red crosses in the CC plots indicate the input parameter combinations for which additional activity injections were applied (see Table 2).

