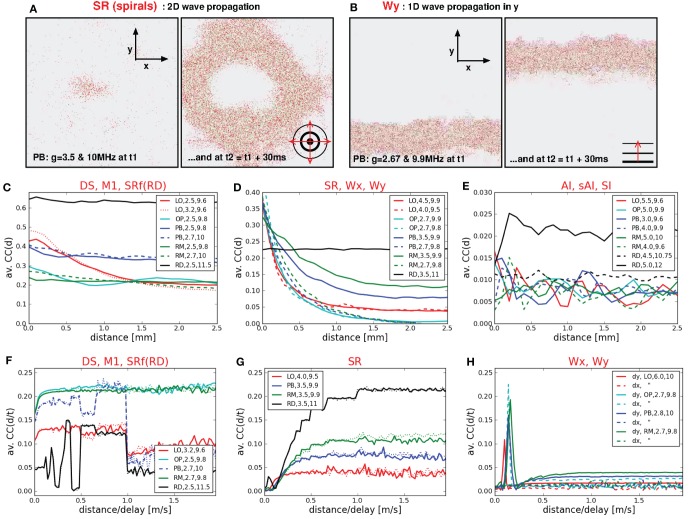
Figure 6.
Spatio-temporal activity propagation. (A,B) Two 2d sheets of cortex, each at two different time steps. Each dot represents the position of a spike of a single neuron. (A) Shows a circular spherical wave propagation while (B) shows a plane wave of spikes that propagates only in y-direction. (C,D,E,F,G,H) Distance-dependent and velocity-dependent average correlation coefficients, subdivided into different categories according to the dynamical state. (C,F) CC(d) and CC(d/τ) for states with extremely high firing rates (DS, M3, SR of RD networks), (D) CC(d) for states with medium to high firing rates (SR, Wx, Wy), (E) CC(d) for states with low firing rates, (G) CC(d/τ) for 2d waves, (H) CC(d/τ) for 1d waves.

