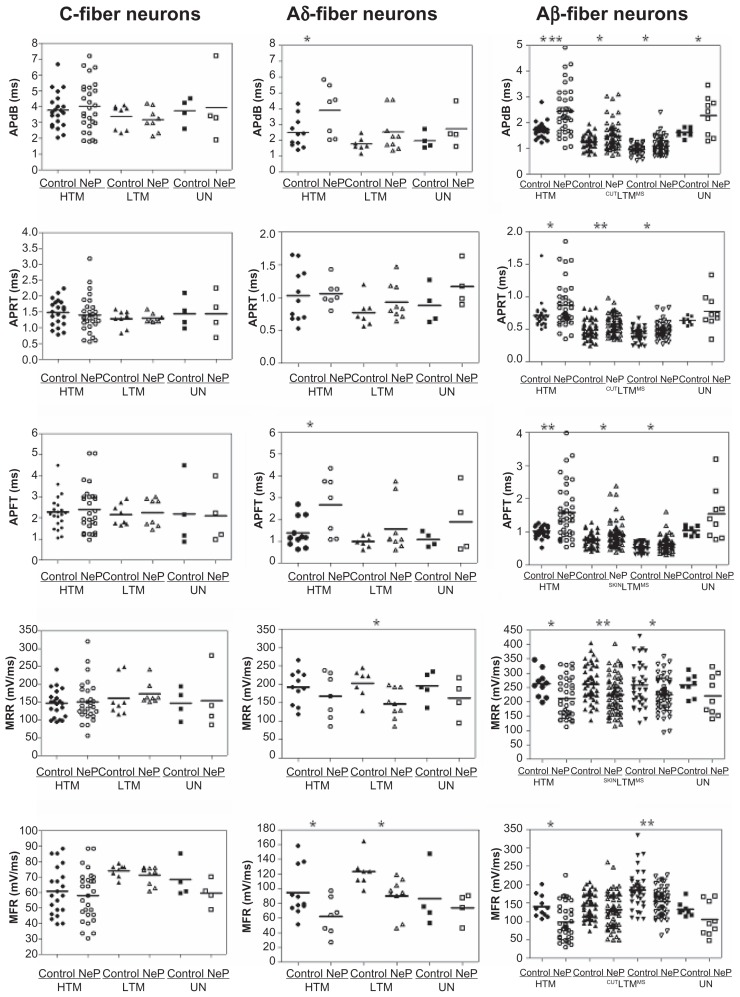
Figure 3.
Comparison of action potential dynamic parameters of dorsal root ganglion neurons between control and neuropathic rats. Scatter plots show the distribution of the variables with the median (horizontal line) superimposed in each case.
Notes: Asterisks above the graph indicate the significant differences between control and neuropathic animals: *P < 0.05, **P < 0.01; ***P < 0.001. The absence of an asterisk indicates the lack of a statistically significant difference.
Abbreviations: APdB, action potential duration at base; APRT, action potential rise time; APFT, action potential fall time; MRR, maximum AP rising rate; MFR, maximum AP falling rate; HTM, high threshold mechanoreceptor neurons; LTM, low threshold mechanoreceptor neurons; UN, unresponsive neurons.

