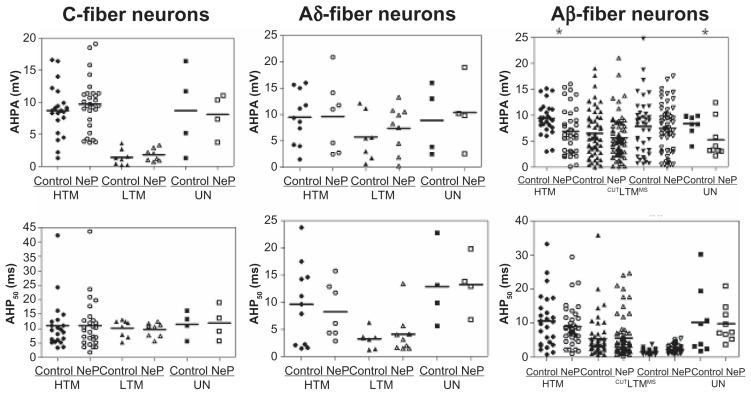
Figure 4.
Comparison of AHP variables of DRG neurons between control and neuropathic rats. Scatter plots show the distribution of the variables with the median (horizontal line) superimposed in each case.
Notes: Asterisks above the graph indicate significant differences between control and neuropathic animals: *P < 0.05, **P < 0.01; ***P < 0.001. The absence of an asterisk indicates the lack of a statistically significant difference.
Abbreviations: AHPA, afterhyperpolarization amplitude; AHP50, afterhyperpolarization duration to 50% recovery; HTM, high threshold mechanoreceptor neurons; LTM, low threshold mechanoreceptor neurons; UN, unresponsive neurons.

