
Figure 2.
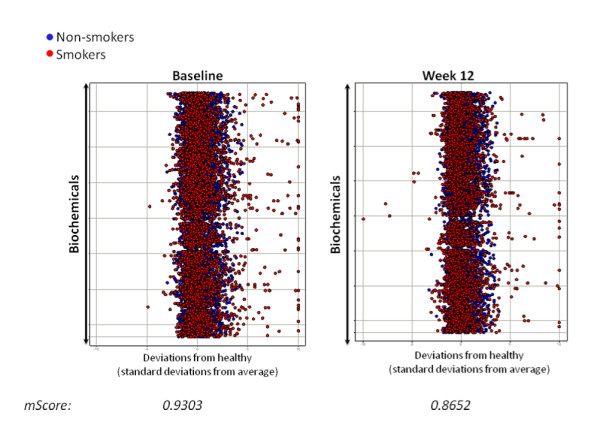
Decreased deviation of metabolites from normal distribution after 12 weeks of study supplement, most notably in the smoker group. Scatterplots showing absolute values of z-scores for all metabolites at baseline and after 12 weeks of taking the study supplement. The mScore is an average of all z-scores in the entire population. An mScore of 0.77 indicates a normal distribution. Red spot = smokers; blue spot = non-smokers.