
Figure 3.
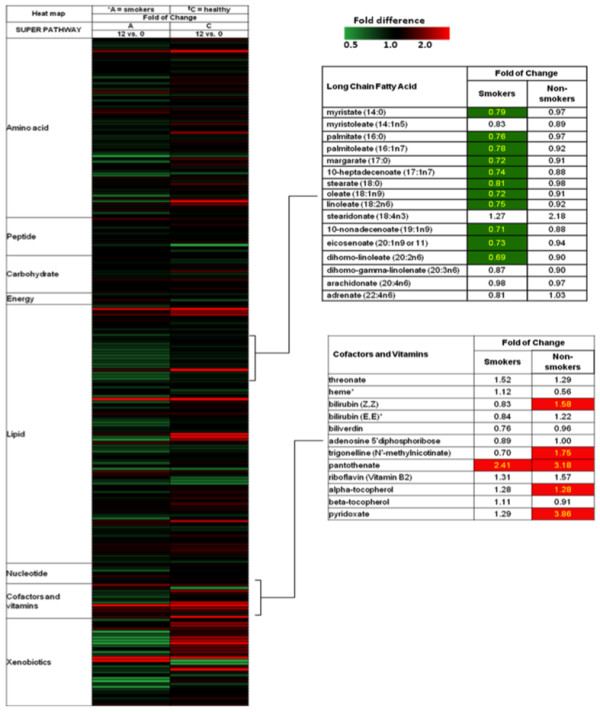
Heat maps demonstrating fold change of metabolites in smokers and non-smokers. The heat maps show that smokers had significantly decreased levels of (long chain fatty acids) but not the cofactors and vitamins listed below, after 12 weeks of study supplementation. Green band = decrease; red = increase