
Figure 4.
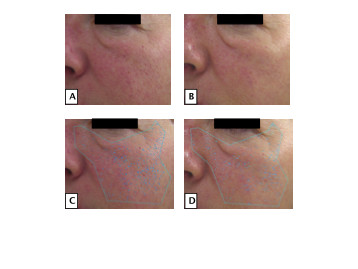
Patient skin glow and UV spots. (a, b) Example of an increase in glow at week 12 (b) compared to week 0 (a) as determined by a panel of four blinded dermatologists. (c, d) Example of a decrease in UV spots at week 12 (Figure d) compared to week 0 (c) in a participant as determined by VISIA Complexion Analysis System.