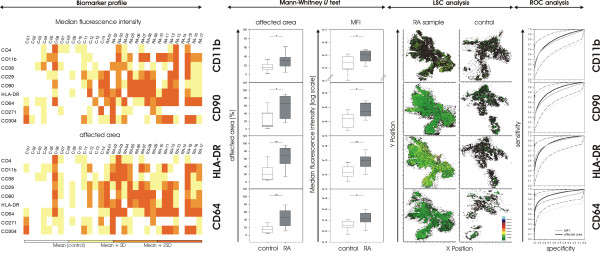
Figure 1.
Biomarkers for rheumatoid arthritis (RA) classification. The biomarker profile (left) gives an overview of tested markers for each subject. For color-coding, mean of the respective control subjects +SD (+2 SD, > 2 SD) was used for each marker. CD4 and CD271 showed no difference in expression between control and RA, whereas CD64 or HLA-DR was significantly more highly expressed in RA patients. This is also apparent in color-coded tissue analysis with laser scanning cytometry (LSC). Significant differences were found for CD11b, CD90, HLA-DR, and CD64 (center, * P ≤ 0.05; * P ≤ 0.001). Box plots show median and 25th/75th percentile, and whiskers, 5th/95th percentile. Receiver operating characteristic (ROC) analysis revealed that number and distribution of labeled cells (that is, affected area) delivered most often higher sensitivity in identifying RA than did median fluorescence intensity (MFI) values. CD64 proved to be the best single discriminatory marker, with AUC = 0.8942 (right).

