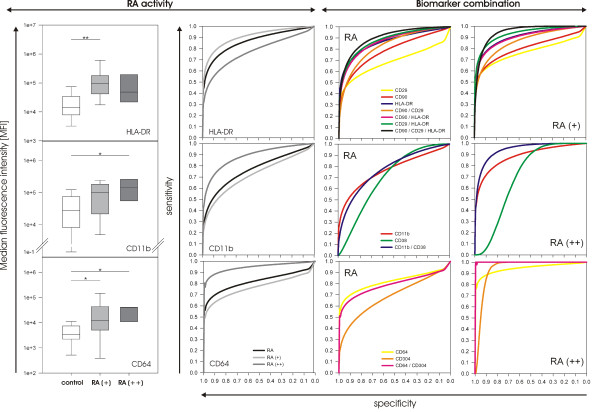
Figure 2.
Classification of rheumatoid arthritis (RA) subgroups and panel analysis. Among the tested biomarker candidates, HLA-DR and CD64 had the highest discriminatory capability. However, most of the markers showed a clear preference for identifying one of both RA subgroups. Results are shown for median fluorescence intensity (MFI) values of RA(+) and RA(++). HLA-DR was a suitable marker for identification of RA(+) (P = 0.0006), whereas CD11b was better for classification of RA(++) (P = 0.0159). Expression of CD64 was significantly different from control for both RA(+) (P = 0.0156) and RA(++) (P = 0.004). Box plots show median and 25th/75th percentile; whiskers, 5th/95th percentile. Missing whiskers are due to the few RA(++) patients (n = 5). Higher sensitivity for the respective RA subgroup is also visible in receiver operating characteristic (ROC) analysis (center). Combination of markers increased sensitivity in classification of RA, as demonstrated by ROC analysis for MFI (right). Higher AUC values were obtained for the panels than for the individual markers (for AUC values, see Tables 2 and 3). However, the preference for one of both RA subgroups is obvious (last column). The same tendency is applied for analysis of affected area, although in this case, the increase did not reach the level of MFI. Confidence intervals in ROC graphs are not displayed because of visual simplicity.

