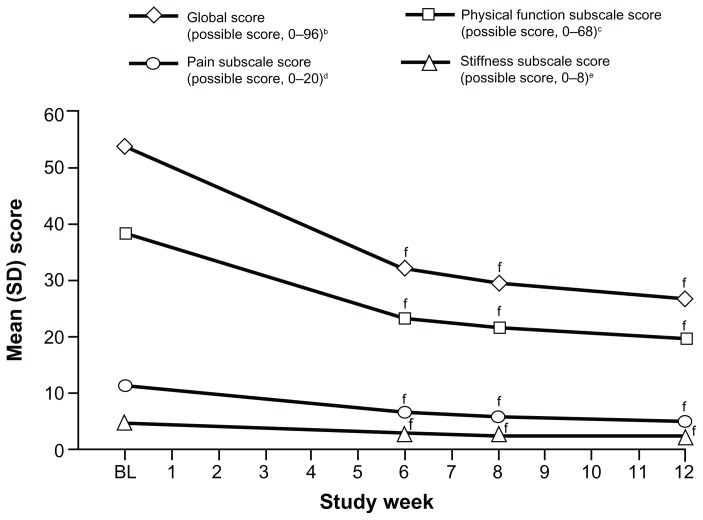
Figure 5.
Mean WOMAC osteoarthritis index subscale and global scores over time (main analysis population; observed-case analysis).a
Notes: aData from Weeks 9 through 12 for patients in the Substudy A population were excluded; bSDs: BL, 14.58; W6, 18.80; W8, 17.89; W12, 18.71; cSDs: BL, 11.06; W6, 13.84; W8, 13.03; W12, 13.64; dSDs: BL, 3.11; W6, 3.93; W8, 3.72; W12, 3.86; eSDs: BL, 1.63; W6, 1.74; W8, 1.68; W12, 1.71; fP < 0.0001 for the change from BL.
Abbreviations: WOMAC, Western Ontario and McMaster Universities; SD, standard deviation; BL, baseline; W, Week.

