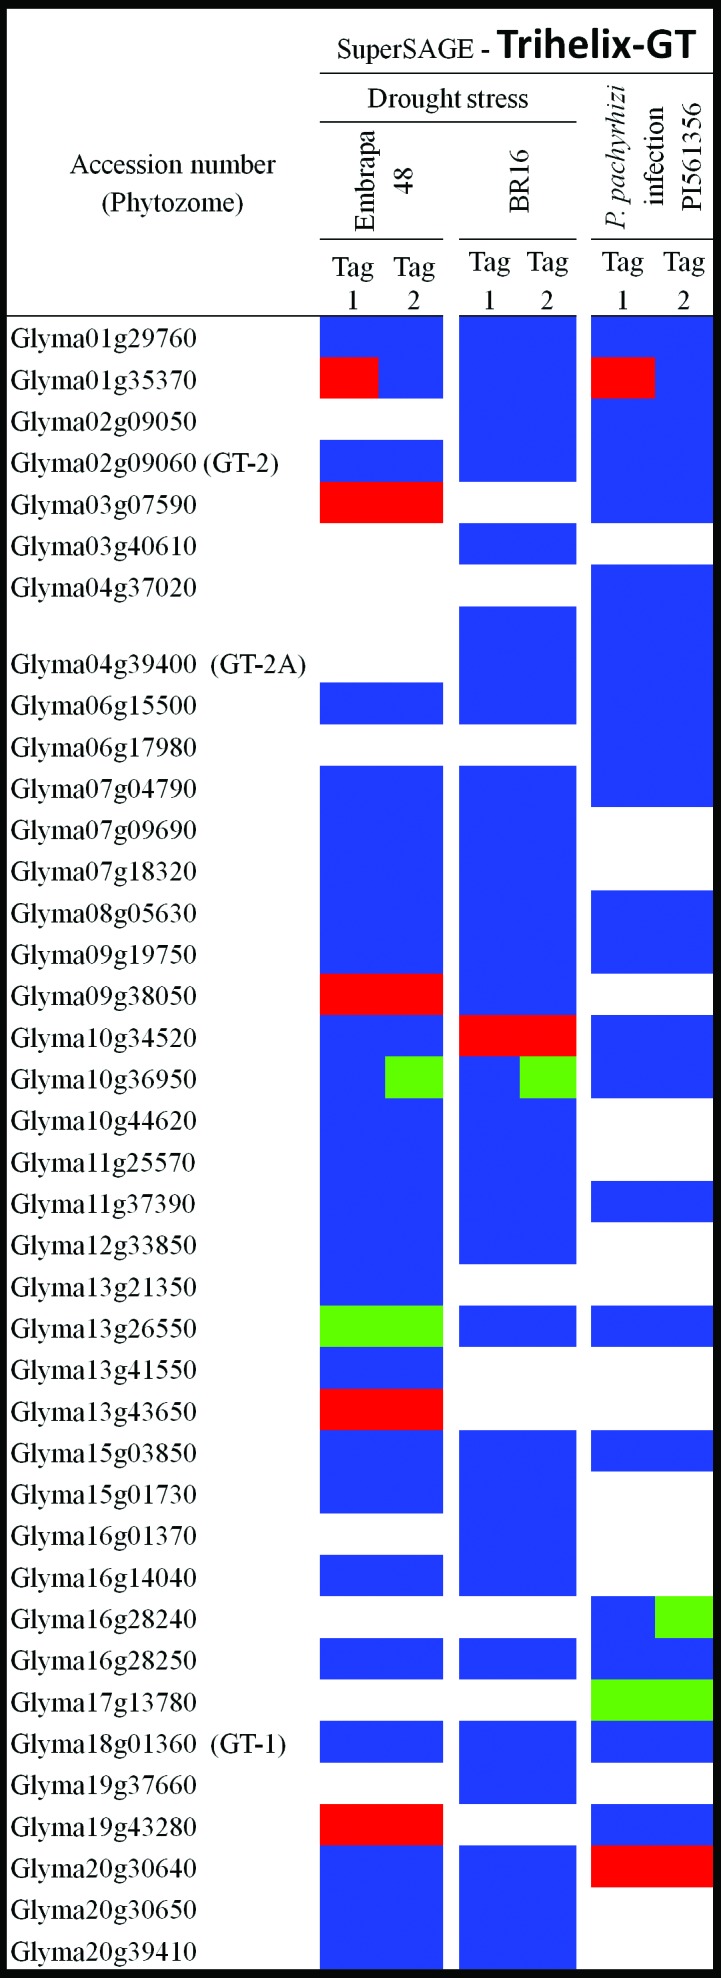
Figure 3.

Expression pattern of trihelix-GT encoding-genes under drought stress and P. pachyrhizi infection. The expression data were obtained from superSAGE experiments available at www.lge.ibi.unicamp.br/soja/. Blocks indicate up-regulation (red), down-regulation (green), non-significant differences (p > 0.05) but expression detected (blue), and expression not detected (white). Contrasting expression might reflect detection of a single gene by different tags. Drought stress was carried out in roots from Embrapa-48 (tolerant cultivar) and BR 16 (susceptible cultivar). Soybean leaves from PI561356 (resistant genotype) were infected with P. pachyrhizi.
