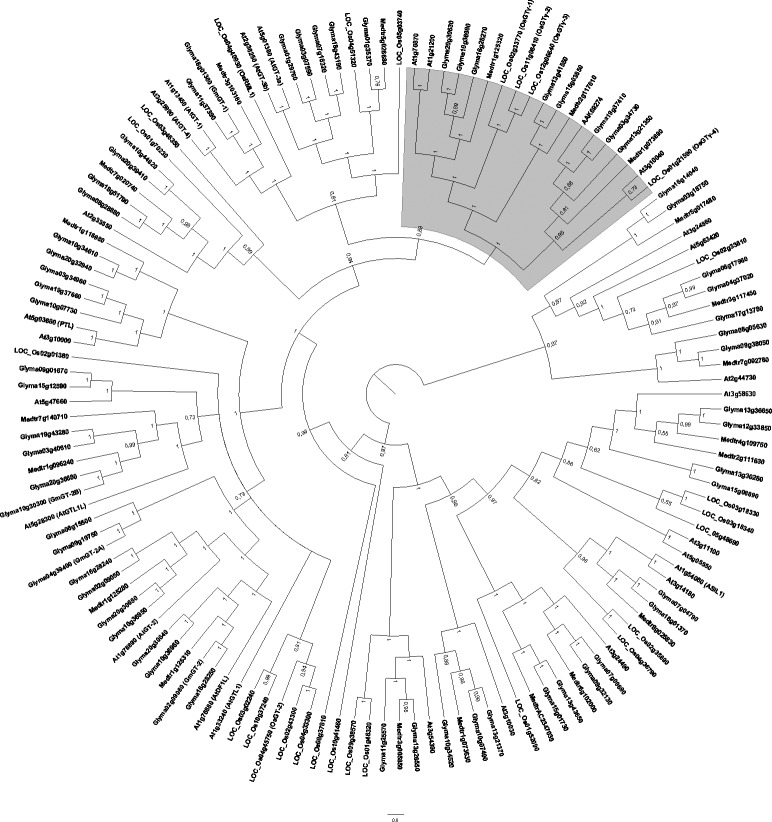
Figure 4.
Bayesian phylogenetic tree of 137 plant trihelix-GT proteins. The Bayesian analysis was conducted using Mr.Bayes v3.1.2 software after alignment of full-length trihelix-GT proteins from selected plant species using ClustalW. The unrooted cladogram was edited using Fig Tree ver. 1.3.1 software. Nodal support is given by posteriori probability values shown next to the corresponding nodes. The scale bar indicates the estimated number of amino acid substitutions per site. The gray area denotes GTγ subfamily described by Fang et al. (2010). Previously reported GT factors were identified according to their accession/locus numbers, the other genes were designated according to their locus ID at Phytozome. A. thaliana (At); G. max (Glyma); Medicago truncatula (Medtr) and O. sativa (LOC_Os).

