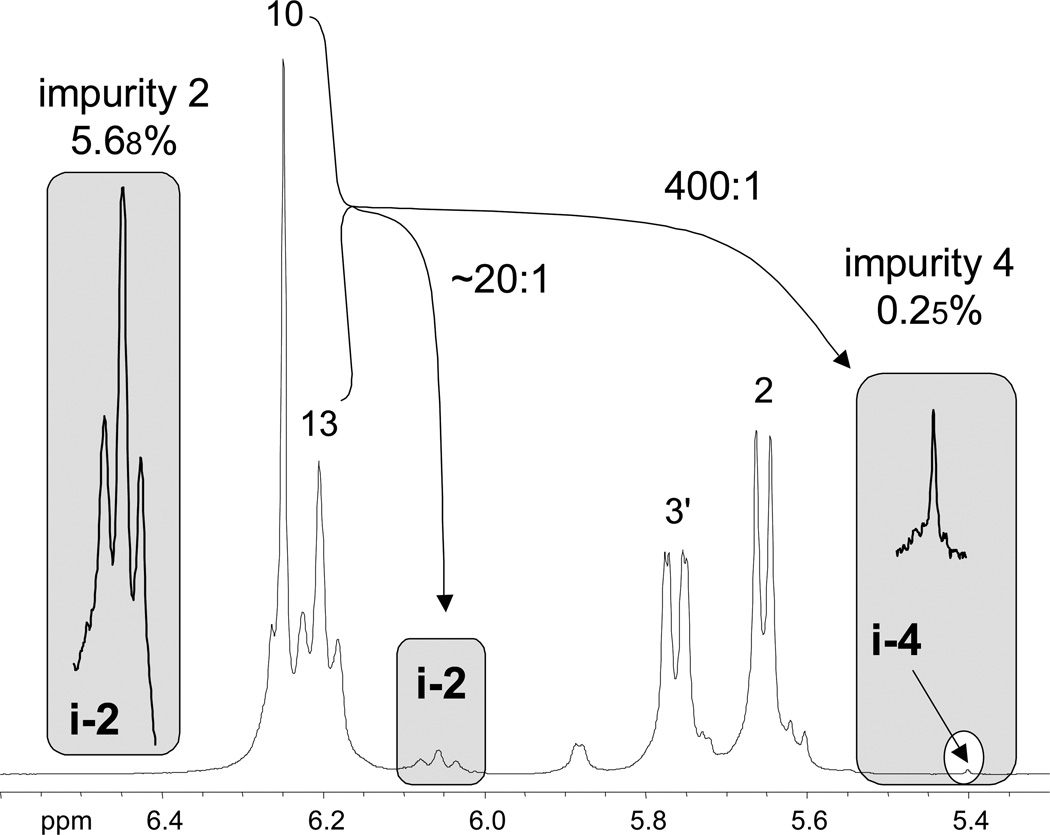
Figure 3.
Provided that the chemical shift dispersion is sufficient, the proposed qHNMR experiment can routinely detect and quantitate minor impurities with a dynamic range of 300:1 or better. This example demonstrates the relative intensities of the signals of the impurities i-2 (5.68%) and i-4 (0.25%) and their relationship with the main resonances of the 84.8% pure taxol sample B. The remarkable 400:1 dynamic range between taxol and its impurity i-4 also visualizes how readily the signals of minor impurities can be overlooked and/or buried under noise unless NMR spectra are acquired with adequate S/N.

