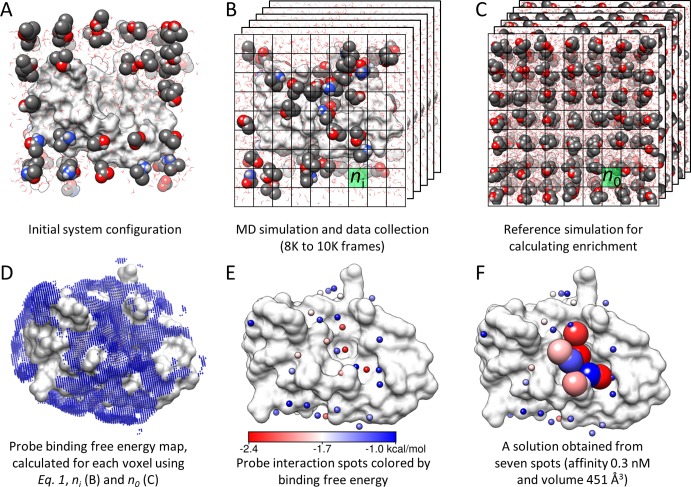
Figure 1.
Overview of methodology. (A) The druggability simulation box is prepared by immersing the target protein in a box of water and probe molecules. (B) After the superposition of frames onto the X-ray structure using Cα atom positions, a grid representation is used to measure the probe density (ni). (C) A protein-free system is simulated to calculate the expected probe density (n0) used in eq 1. (D) The binding free energy for each voxel is calculated using eq 1. Note that only the outer layer (weaker) interactions are visible in the map. (E) Interaction spots (small spheres) are identified by removing the voxels that overlap with the lower energy voxels. The energy scale in this panel holds for panels D and F as well. (F) Proximal spots are merged to predict maximal affinity. Interaction spots that are in a druggable site are shown as larger spheres color-coded by the corresponding interaction energies with the target. Molecular graphics in this study are generated using Chimera.79

