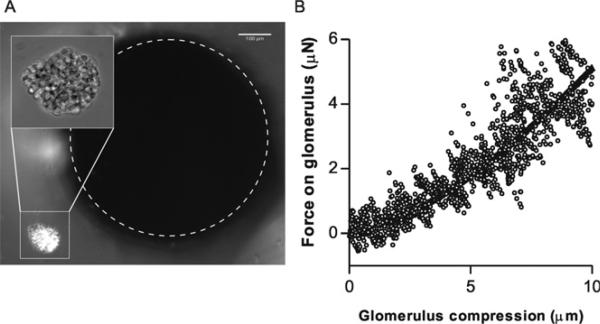
Figure 2.
Quantitative compression of microscopic objects. (A) A single isolated mouse glomerulus (imaged at 40× in inset) positioned near the tip of the milli-indenter. (B) Force–compression behavior of a mouse glomerulus compressed at 0.04 μm s–1. Fit is a Hertz model fit (equation (4)—glomerulus is simplified as a 100 μm solid sphere with ν = 0.5) with .

