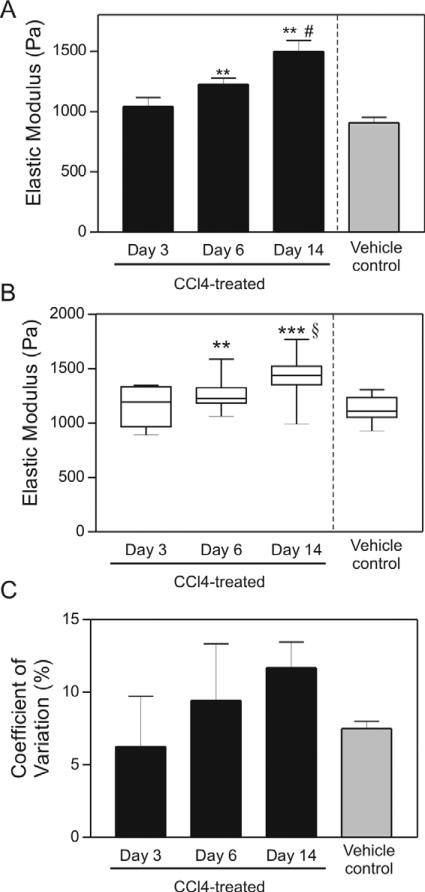
Figure 4.
Micrometer-scale variation of normal and fibrotic liver tissue. (A) Average elastic modulus from bulk rheological measurements of liver tissue after treatment with CCl4 or vehicle for indicated time. Data are represented as mean ± SD. These bulk rheometry measurements are a subset of those described in Georges et al (2007) and are shown here for comparison with indentation measurements. (B) Box plot of elastic modulus measurements determined by indentation of tissue from the same livers showing mean values and variance increase with time of CCl4 treatment. (C) Quantification of COV of liver tissue after treatment with CCl4 or vehicle for indicated time. Data are represented as the mean ± SD. ** p ≤ 0.01, *** p ≤ 0.001 comparing 3-day to 6- and 14-day CCl4-treated tissues. # p ≤ 0.01 comparing to vehicle to CCl4-treated tissues. § p ≤ 0.001 comparing to vehicle to CCl4-treated tissues. With the exception of one liver from an oil-injected animal which was measured in three regions, all liver slices were measured in five different regions. Numbers of livers per time point ranged from 2 to 4.

