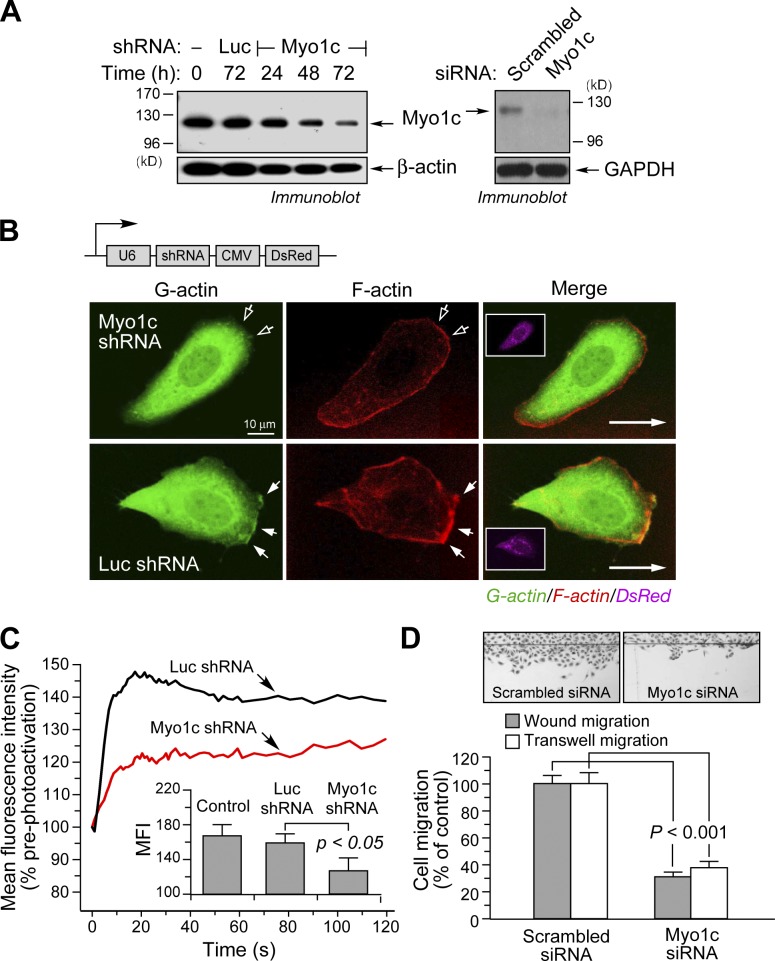
Figure 5.
Myo1c is required for G-actin delivery to the leading edge and optimal cell migration. (A) Knockdown of Myo1c by shRNA and siRNA. Cells were transfected with shRNA targeted against Myo1c or Luc or Myo1c or scrambled siRNA, and Myo1c protein was detected by immunoblotting. GAPDH, glyceraldehyde 3-phosphate dehydrogenase. (B) Cells were transfected with a plasmid coexpressing DsRed and shRNA targeted against Luc or Myo1c and stained to visualize G- or F-actin. The insets show coexpressed DsRed. Long arrows indicate the direction of cell migration. Filled arrows indicate regions enriched in G- or F-actin, and open arrows indicate the cell leading edge in regions of reduced G- or F-actin. CMV, cytomegalovirus. (C) Cells were cotransfected with vectors expressing paGFP-actinG13R and shRNA targeted against Luc or Myo1c, and paGFP-actinG13R movement was detected by photoactivation. Dynamics in the forward region near the leading edge fluorescence intensity after photoactivation in the lamellipodia are shown. (inset) Mean fluorescence intensity (MFI) 15 s after photoactivation (mean fluorescence intensity ± SEM; n = 8–12 cells). (D) Cells were transfected with Myo1c or scrambled siRNA and subjected to wound-induced migration and VEGF-A–induced chemotaxis. The number of migrating cells was determined (mean ± SEM; three independent experiments).

