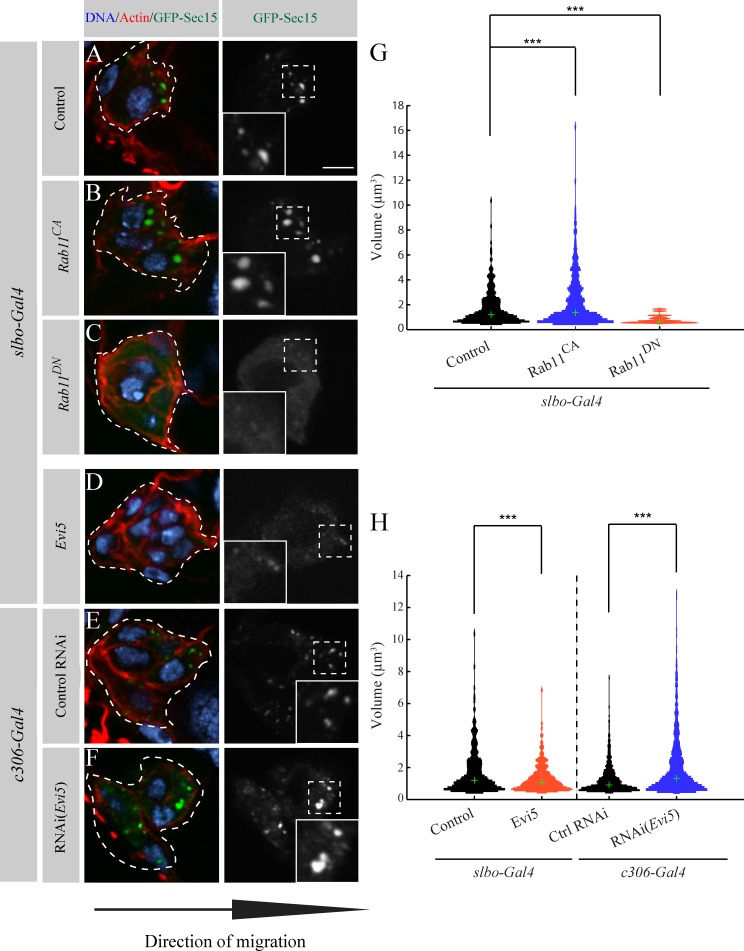
Figure 4.
Evi5 regulates Rab11 during BC migration. (A–F) Representative images showing the distribution of GFP-Sec15 at the onset of migration (stage 9) for the indicated conditions. The dotted lines outline BC clusters as determined by the GFP signal. The insets show a higher magnification of the regions marked by dashed line squares. Bar, 5 µm. (G and H) Computational analysis of the conditions (A–F) as in Fig. S1 F (504 < n vesicles < 1,682; ***, P < 0.05; KS test and rank sum test; Fig. S1 G). Green crosses indicate the medians of the thresholded distribution.

