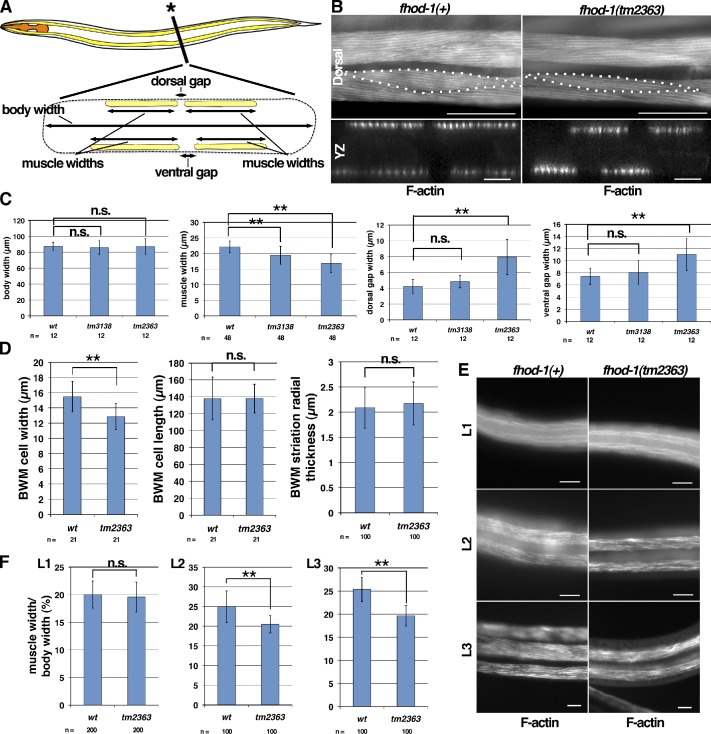
Figure 5.
BWM cell growth and positioning are aberrant in fhod-1 mutants. (A) A schematic lateral view of C. elegans (anterior to the left) with a cross section view at the asterisk shows positions of pharyngeal muscles (orange) and BWMs (yellow). The squashed body outline in cross section (dashed line) is consistent with a fixed animal mounted for microscopy, as in B. Dimensions quantified in C are indicated in the cross section schematic. (B) Dorsal and cross section views (yz projections) of fluorescent phalloidin-stained young adults show that fhod-1(tm2363) BWMs are narrower and spaced further apart than wild type. Dotted lines indicate individual BWM cell boundaries. Bars: (dorsal) 50 µm; (yz) 10 µm. (C) Young adult fhod-1 mutants (tm3138 and tm2363) have similar body widths as wild type (wt) but narrower muscles, and fhod-1(tm2363) animals have wider gaps between paired muscles at dorsal and ventral surfaces. Results shown are representative of two independent experiments. (D) Fluorescent phalloidin-stained fhod-1 (tm2363) BWM cells have normal anterior/posterior lengths and radial thicknesses but reduced lateral widths. (E) Ventral views of BWMs in fluorescent phalloidin-stained L1-, L2-, and L3-stage larvae. Bars, 10 µm. (F) Discrepancy between wild-type and fhod-1 mutant (tm2363) BWM widths, expressed as a percentage of total body width, is apparent in L2 and L3 but not L1 stages. Results shown are representative of two independent experiments. For all quantitative results, mean values of n measurements are presented. Error bars indicate one standard deviation. n.s. indicates not significant, P > 0.05. **, P < 0.001.

