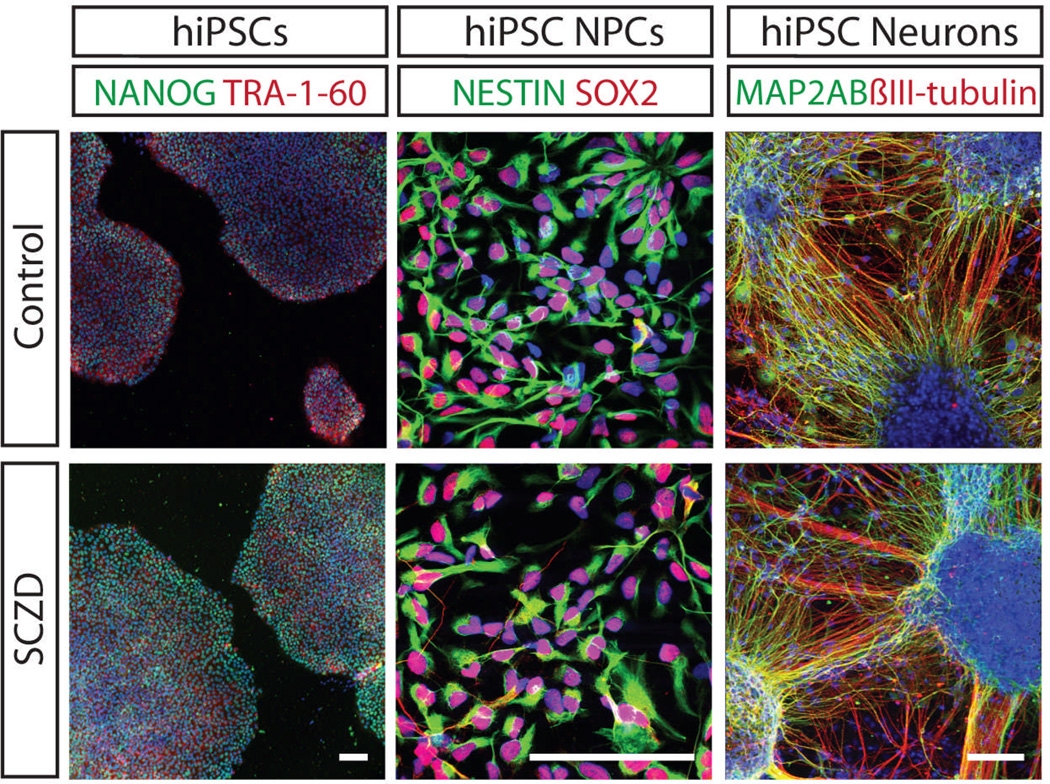
Fig. 1. Patient-specific hiPSCs, NPCs and neurons.
Left. hiPSCs express NANOG (green) and TRA-1-60 (red). DAPI (blue). ×100, scale bar 100 µm. Centre. hiPSC neural progenitor cells (NPCs) express NESTIN (green) and SOX2 (red). DAPI (blue). ×600, scale bar 100 µm. Right. hiPSC neurons express βIII-tubulin (red) and the dendritic marker MAP2AB (green). DAPI (blue). ×200, scale bar 100 µm.

