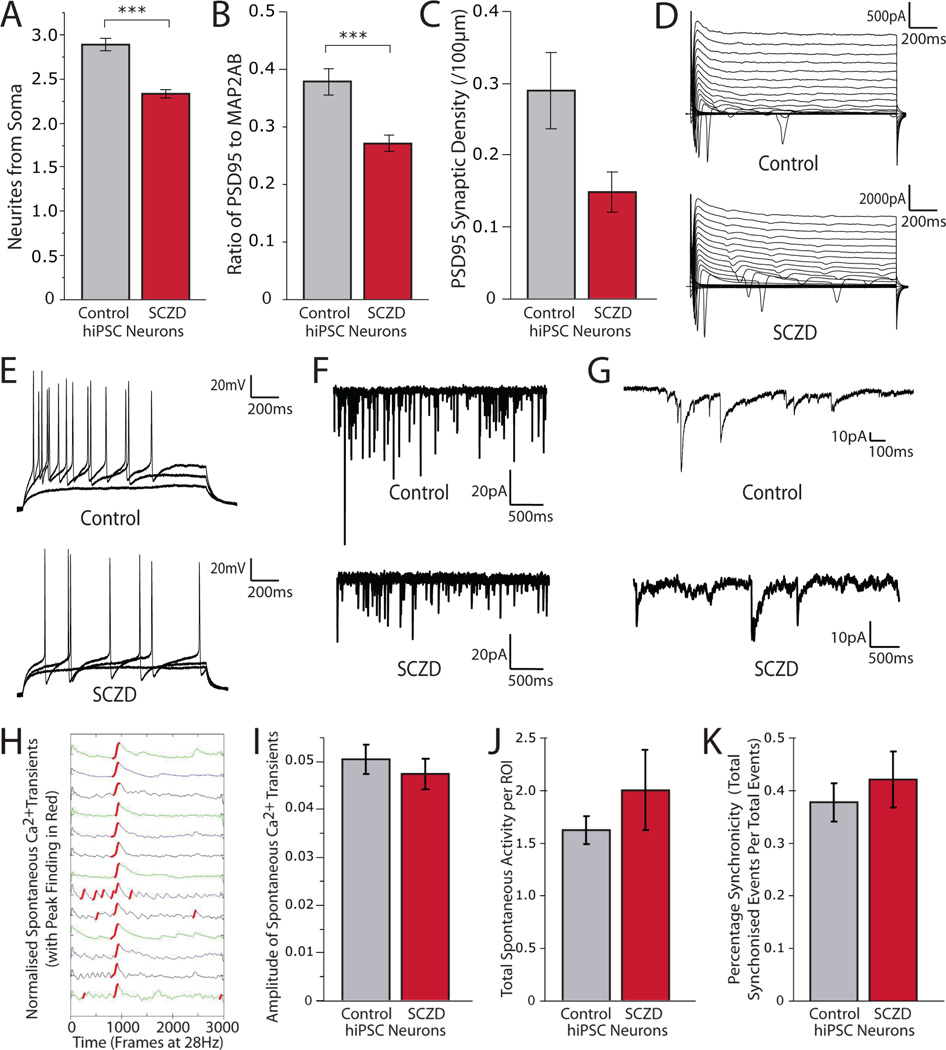
Fig. 3. Decreased neurites and synaptic protein levels but normal electrophysiological and spontaneous calcium transient activity in SCZD hiPSC neurons.
A. Graph showing decreased neurites in SCZD hiPSC neurons. B. Graph showing decreased PSD95 protein relative to MAP2AB for SCZD hiPSC neurons. C. Graph showing a trend of decreased PSD95 synaptic density in SCZD hiPSC neurons. D–G. Electrophysiological characterization. hiPSC neurons cultured on astrocytes show normal sodium and potassium currents when voltage-clamped (D), normal induced action potentials when current-clamped (E), and spontaneous excitatory (F) and inhibitory (G) synaptic activity. H–K. Spontaneous calcium transient imaging. Representative spontaneous Fluo-4AM calcium traces of fluorescent intensity versus time generated from three-month-old hiPSC neurons (H). Graph showing no difference between the spike amplitude of spontaneous calcium transients of control and SCZD hiPSC neurons (I). Graph showing no difference between the total numbers of spontaneous calcium transients per total number of ROIs in cultures of control and SCZD hiPSC neurons (J). Graph showing no change in percentage synchronicity per calcium transient in control and SCZD hiPSC neurons (K). Error bars are SE. Asterisks used as follows: *** p<0.001.

