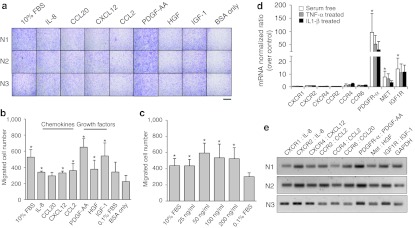
Figure 1.
Comparison of the chemotactic activity of chemokines and growth factors in human MSCs. (a) Migrated cells stained with hematoxylin and eosin. Bar = 400 µm. (b) The number of migrated cells. (c) The dose effect of PDGF-AA on MSCs migration. The bars represent the mean ± SD of migrated cells. n = 3, *P < 0.05 to the negative control. (d) Real-time PCR analysis of receptors. The bars represent the mean ± SD of normalized ratio over the control. n = 3, *P < 0.05 to CXCR2. (e) Gel electrophoresis of the RT-PCR products of each receptor. BSA, bovine serum albumin; CCL2, chemokine (C-C motif) ligand 2; CXCL12, chemokine (C-X-C motif) ligand 12; FBS, fetal bovine serum; GAPDH, glyceraldehyde-3-phosphate dehydrogenase; HGF, hepatocyte growth factor; IGF, insulin-like growth factor; IL, interleukin; mRNA, messenger RNA; MSC, mesenchymal stem cell; PDGF, platelet-derived growth factor; RT-PCR, reverse transcription-PCR; TNF-α, tumor necrosis factor-α.

