Figure 2.
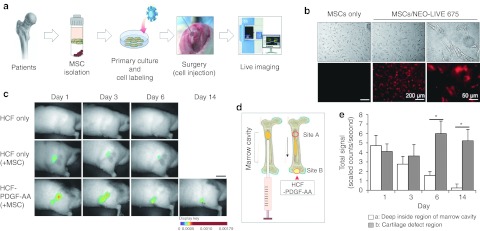
In vivo monitoring of fluorescent nanoparticle-labeled human MSCs in athymic nude rats. (a) The general schema of in vivo experiments. (b) Human MSCs labeled with a fluorescent silica nanoparticle. The left panels are the bright-field images, and the right panels are Cy5.5 fluorescence images. (c) In vivo monitoring of nanoparticle-labeled MSCs. Bar = 20 mm. (d) Two specific sites of signal measurements. Site A represents the most proximal portion of the marrow cavity. Site B represents the osteochondral defect area releasing PDGF-AA. (e) Quantification of the MSCs migration effect by PDGF-AA release from the osteochondral defect in PDGF-AA-loaded HCF group. The bars represent the mean ± SD of fluorescent signal intensity. n = 3, *P < 0.05. HCF, heparin-conjugated fibrin; MSC, mesenchymal stem cell; PDGF, platelet-derived growth factor.

