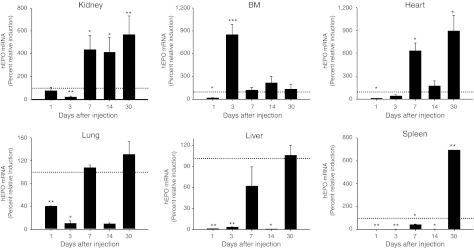
Figure 3.
Temporal and spatial distribution of human erythropoietin (hEPO) mRNA expression after polyplex injection. Sprague-Dawley (SD) rats (n ≥ 4) were intravenously injected with either 200 µg phEPO/ABP at wt/wt ratio 1/10 or 200 µg phEPO/PEI at wt/wt ratio 1/1. We evaluated the in vivo expression level of hEPO mRNA using real-time quantitative reverse transcriptase (RT)-PCR at the indicated times in organs after injection of the polyplexes. Error bars represent SEM with n = 5–10 per group. *P < 0.05, **P < 0.01, and ***P < 0.001 compared with phEPO/PEI (dashed line as 100%).

