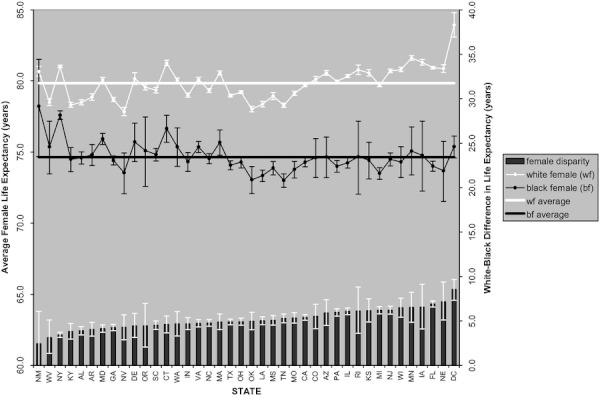
Figure 2.

State Variation in Female Life Expectancy. The absolute life expectancy for white (white line) and black (black line) women with 95 percent error bars for the states/region analyzed. The black bars represent the racial disparity or difference in white–black life expectancy. The national average life expectancy for white women is 78.79 years, black women is 73.59 years, and a disparity of 5.20 years
