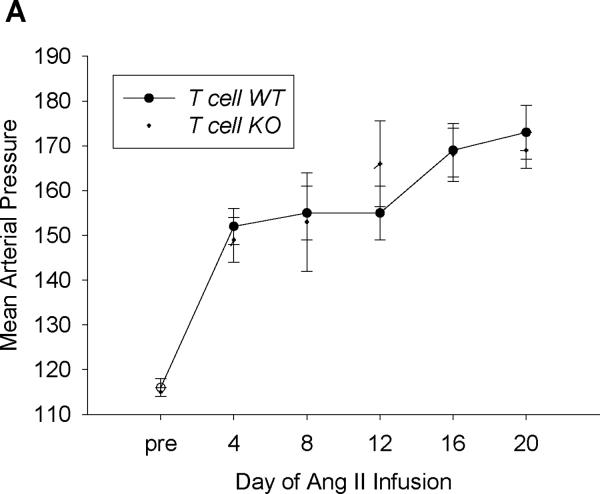
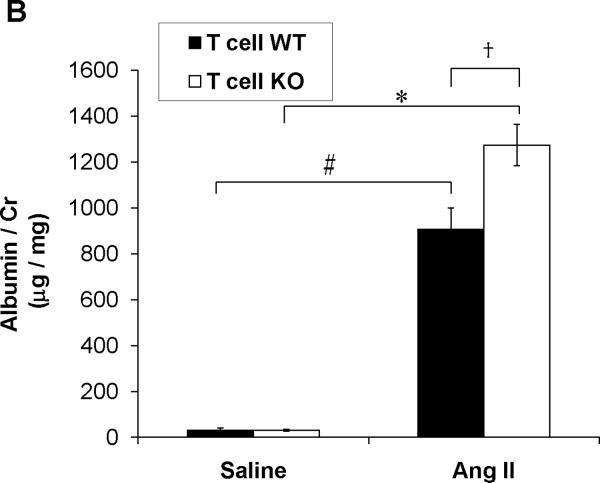
Figure 2. Activation of AT1A receptors on T lymphocytes protects from hypertensive kidney injury.
A, Baseline blood pressures were measured by radiotelemetry for 3 days. Then experimental mice were infused for 28 days with angiotensin II (1000ng/kg/min) via subcutaneously implanted osmotic minipump. Mean arterial pressures are depicted for T cell WT (n=11) and T cell KO (n=12) littermates. B, Urine samples were collected by placing experimental mice into metabolic cages after 25 days of saline or Ang II infusion. Urinary albumin excretion was quantitated per methods. #P<0.001 vs. Saline T cell WT; *P<0.0001 vs. Saline T cell KO; †P<0.009 vs. Ang II T cell WT. C-E, Staining of glomerular podocytes with WT1 antibody following 4 weeks of Ang II. Podocytes stain bright green. Representative images of (C) T cell WT and (D) T cell KO glomeruli. (Magnification 40×) E, number of podocytes per glomerulus in T cell WT and KO kidneys (6 mice per group). *P=0.02 vs. T cell WT. F, Renal NGAL mRNA expression in saline- or Ang II-infused T cell WT or T cell KO mice. #P<0.02 vs. Saline T cell WT; *P=0.005 vs. Saline T cell KO; †P=0.001 vs. Ang II T cell WT.


