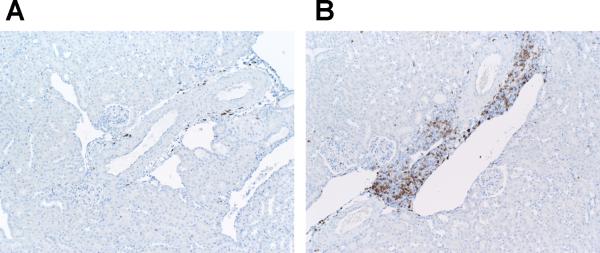
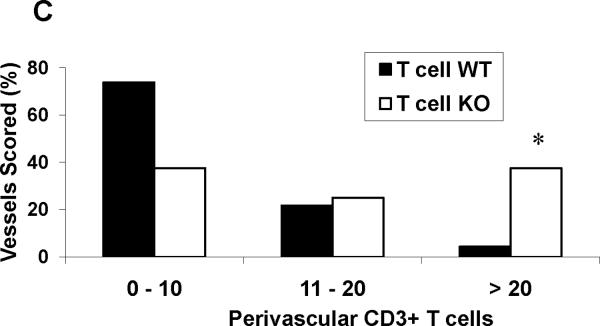
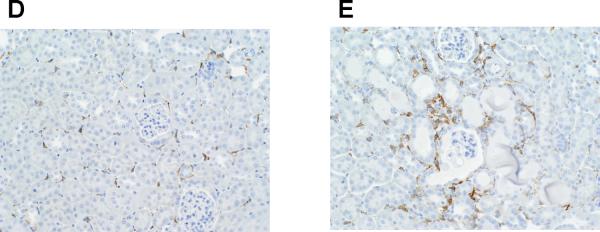
Figure 3. Role of the AT1A receptor on T cells in regulating infiltration of mononuclear cells into the kidney during Ang II-dependent hypertension.
Embedded kidney sections were obtained from Ang II-infused T cell WT and KO mice and stained with anti-CD3 or anti-F4/80 antibody. A–B, representative images of T lymphocyte staining in kidneys from Ang II-infused (A) T cell WT mice and (B) T cell KO mice. C, proportion of renal vessels from Ang II-infused T cell WT and KO groups surrounded by 0–10, 11–20, or >20 CD3+ T cells, respectively. *P<0.0001 vs. T cell WT (Fisher's exact test across all 3 tertiles). D–E, representative images of macrophage staining in kidneys from Ang II-infused (D) T cell WT and (E) T cell KO mice.


